Information Technology and Hybrid Organizations

1. INFORMATION TECHNOLOGY AND HYBRID ORGANIZATIONS

Over the past decade, a variety of new organizational forms have emerged, such as the networked organization,1 the horizontal organization,2 and the multi-dimensional matrix.3 These new organizations attempt to combine entrepreneurial initiative with the coordination traditionally achieved by bureaucracies. They will therefore be referred to throughout this paper as "hybrid" organizations. Much of the managerial literature related to hybrid organizations points to the importance of Information Technology (IT) in enabling these new forms.4 Apparently, IT has enlarged the set of feasible organizational designs.

This paper takes the empirical relevance of hybrid organizations as given, based on the strength of anecdotal evidence (see Section 2 below) and despite a relative lack of solid empirical evidence about the phenomenon.5 Instead, it provides an economic model that captures some important intuitions about the role of IT. The model establishes a trade-off between initiative and coordination in organizations. IT is shown to "push out" the trade-off frontier, thus enabling hybrid organizations that achieve both more initiative and more coordination than traditional organizations.6 The mechanism by which this is achieved has important implications for the management of hybrid organizations. It also suggests ideas for empirical work and promising directions for further theory development.

The paper is structured as follows: Section 2 summarizes some of the anecdotal evidence on hybrid organizations; Section 3 develops the intuition behind the trade-off between initiative and coordination; Section 4 presents and analyzes a formal model; Section 5 interprets broad historical evidence in light of the model; Section 6 illustrates the model using a case study; Section 7 discusses managerial implications; and Section 8 concludes with ideas for empirical work and directions for theory development.

1 See van Alstyne (1996).
2 See Byrne (1993).
3 See Bartlett and Ghoshal (1990).
4 See Hammer and Champy (1993) or Davenport (1993).
5 See Brynjolfsson and Hitt (1996) for some first empirical evidence.
6 I am grateful to Bengt Holmstrom for suggesting the notion of an initiative-coordination frontier.

2. ANECDOTAL EVIDENCE ON HYBRID ORGANIZATIONS

2.1 Horizontal Organizations

It appears that a number of companies have adopted so-called horizontal organizations (Byrne 1993). They have gone through "delayering," i.e. reducing the number of management layers between the CEO and the employees, generally in the course of a reengineering effort. They have organized around projects and processes which are "horizontal" compared to the "vertical" functions of traditional organizations, such as marketing and production. In these horizontal organizations, the number of employees supervised by a manager is much higher than in vertical organizations.

For example, the Danish hearing aid maker Oticon has an organization based almost entirely on projects.7 Through the use of IT, paper has been almost completely eliminated and employees have moveable desks (and even moveable potted plants) that can be reconfigured for new projects. For each project a team of employees with the relevant skills and knowledge is formed. When the project has been completed, the team disbands.

2.2 Networked Organizations

Some other companies have organized as "networks" (van Alstyne 1996). They have formed small units that have individual responsibilities and are sometimes even separate legal entities. All of these units operate on a "playing field," which generally includes a common IT infrastructure and shared procedures. The units cooperate in varying constellations as required by different projects. External units without ownership ties, including suppliers and customers, may also be tied into the network.

Computer Sciences Corporation (CSC) is one of the largest firms in the field of outsourcing of Information Systems.8 The outsourcing value chain has three main stages: consulting, systems design and implementation, and systems operation. The relative importance of these stages varies considerably across customers. CSC is structured internally as a network of smaller firms that operate at the different stages. Depending on the requirements of a particular customer, a different constellation of these smaller firms is formed to deliver the products and services. IT is used extensively to track projects and resources.

7 Based on several Harvard Business School (HBS) case studies on Oticon.
8 Based on discussions with current and former CSC employees.

2.3 Multi-dimensional Matrix

A multi-dimensional matrix is similar to a networked organization in that it consists of a large number of small units (Bartlett and Ghoshal 1990). There are, however, multiple fixed management hierarchies for coordination along dimensions such as geography, customers, and technology. A manager of one of the small units thus has multiple superiors in the different hierarchies. The multi¬dimensional matrix is sometimes seen as a transitional form between the traditional hierarchical organization and the networked organization.

The classic example of such an organization is the two-dimensional matrix at Asea Brown Boveri (ABB).9 One dimension is geographic, with regional and national managers. The other dimension is the global management of a line of business, with managers for individual segments. For almost every intersection of the matrix there is a unit manager with profit and loss responsibility. This manager reports to both a global segment manager and a geography manager. IT is crucial for rapid management reporting from the more than 4,000 individual profit centers.

9 Based on several HBS case studies on ABB.

3. INTUITION FOR THE INITIATIVE - COORDINATION TRADE-OFF

3.1 Bureaucracy and Entrepreneurs

Considering the extreme organizational forms of the traditional bureaucracy on the one hand, and individual entrepreneurs on the other, helps with developing an intuition for the trade-off between initiative and coordination. In a traditional bureaucracy the employees receive flat wages, which generally do not even depend on the exact number of hours worked (at least within certain limits). A disadvantage of wages that do not depend on performance is that employees in traditional bureaucracies tend to exert minimal effort. An advantage, however, is that they can more easily be told how to carry out an activity (given minimal effort), since their salaries are not affected. This can greatly facilitate coordination. Consider, for example, the Internal Revenue Service (IRS), which has to implement the federal tax code uniformly across the United States. With a flat wage, the salary of an IRS employee does not depend on how tax returns are evaluated. This makes it easier to coordinate the uniform treatment of tax returns but sacrifices initiative. 10

Individual entrepreneurs, on the other hand, who wholly own their businesses, are residual claimants. At the margin they obtain 100% (ignoring taxation) of any additional profit. This gives entrepreneurs a strong incentive and helps explain the extraordinary energy most entrepreneurs bring to their businesses. The entrepreneurs show a lot of initiative because they directly benefit from it, but this comes at the sacrifice of coordination. Consider, for example, gourmet restaurants. The star chefs at these restaurants usually have a significant ownership stake, which gives them the incentive to work grueling hours in a high pressure environment. But these chefs generally devote no time at all to coordinating with other gourmet restaurants even though there is a potential for gains (e.g. shared marketing, purchasing of foods, exchange of personnel). Apparently they allocate time to those activities for which they capture all the benefit and not to activities for which some or all of the benefit accrues to others. 11

10 Apparently, in medieval times tax collection was highly decentralized and carried out on a commission basis. This will be seen to fit well with the arguments made here.
11 Based on observing Daniel Boulud, proprietor and chef of one of New York City's best French restaurants.

3.2 Intuition for Tradeoff: Multitasking

The extreme examples of the traditional bureaucracy and the individual entrepreneurs suggest that there is a trade-off between initiative and coordination. An organization that emphasizes coordination will sacrifice initiative and vice versa. The above examples also suggest an intuition for the mechanism behind the tradeoff. Individuals and organizations are faced with many different tasks. In such a multitasking environment they have to not only decide how much effort or how many resources to invest in total, but also how to allocate this effort or these resources among the different tasks. This provides a natural way to interpret both initiative and coordination. Initiative is measured by the total effort or resources that are invested. Coordination is measured by the degree to which effort or resources are allocated by several individuals or units in order to maximize the joint benefit rather than the individual benefits.

Entrepreneurs will exert a lot of effort, but they will allocate it to the tasks that maximize their own benefit. Their effort allocation will not take into consideration the benefits that accrue to others. Increased coordination requires that the allocation choices are based on the overall benefit. This can be achieved by either sharing the overall benefit or by making individual incentives invariant to the allocation. In either case there will be a reduction in initiative. Sharing the overall benefit leads to a free-rider problem, since it is not possible to give everyone the marginal benefit. This is essentially the approach taken in teams and partnerships. Similarly, uncoupling the incentives from the allocation requires reducing the incentives for at least some of the tasks. The most dramatic way of equalizing incentives across tasks is to pay a flat wage as in the example of the bureaucracy.

3.3 Environment and Optimal Choice of Coordination vs. Initiative

Given a trade-off between initiative and coordination, the question arises as to what determines the optimal choice. Phrased differently, the question is which factors in the environment make it optimal to have more initiative and which factors favor coordination. Again simplifying substantially, there appear to be two crucial factors: the predictability of change of the environment and the complexity of the product or service. A rapidly and unpredictably changing environment requires initiative to adapt to the changes and exploit new opportunities as they arise. A complex product or service requires the coordination of many different activities in order to be delivered on time and with high quality.

The two extreme examples given above illustrate this relation between the environment and the optimal choice of initiative versus coordination. The federal tax system changes from year to year, but the changes are quite predictable (they are passed as legislation usually long before they actually take effect) and are generally minor. In addition, there is little need to react to individual "customer" demands. In fact, uniformity is an important goal. The overall "service" is also highly complex as it delivered to every individual and corporate entity in the United States. In terms of the trade-off, it therefore appears reasonable to emphasize coordination over initiative. Star chefs at exclusive restaurants need to respond to the idiosyncrasies of their clientele. They need to react to fashion trends in foods and to the availability of special ingredients. The product itself is not overly complex. It is created in one room (the kitchen) where the chef can coordinate all relevant activities through direct supervision. In terms of the trade-off, it therefore appears reasonable to emphasize initiative over coordination.

Hybrid organizations were defined above as organizations that attempt to achieve both a high degree of initiative and a high degree of coordination. The two highly abstracted environmental factors suggest that one should find hybrid organizations in situations with a rapidly and unpredictably changing environment combined with high product or service complexity. In many industries product cycles have become much shorter and changes in fashion and technology less predictable. At the same time, the complexity of many consumer products has been increasing (e.g. cars). This suggests that changes in the economic environment may be in part responsible for the emergence of hybrid organizations. 12

12 For a discussion of this in the managerial literature see Savage (1995).

3.4 Information Technology (IT) and Hybrid Organizations

The emergence of hybrid organizations also appears to be closely linked with the intensive use of IT. As explored in a separate paper (Wenger 1997a), one of the key effects of IT is to provide finer and more timely partitions of information. Information is at the root of all coordination, i.e. in order for two individuals or organizations to coordinate their activities, they require information about each other's activities. By making information available faster and with greater detail, IT dramatically expands the opportunities for coordination. This suggests that through the intensive use of IT, organizations may be able to achieve a higher degree of coordination for a given degree of initiative, thus shifting out the trade-off frontier. The formal model below explores this effect.

IT also has other important impacts that may affect the initiative-coordination trade-off. For instance, IT can be used to measure performance better and thus enable more precise incentives. To the extent that incentives were muted because of measurement problems, this may result in more initiative. IT can also be used to create "audit trails," i.e. to document activities in a way that can be more easily verified by others (this can also be interpreted as improved measurement). Coordination frequently involves some type of promise by another party to take a particular action. If IT makes actions more easily verifiable, coordination will be facilitated in such situations. In other situations, IT may actually make it harder to measure or verify the outcome of an activity. A classic example is the "Tiger Creek" plant (Zuboff 1985), which eliminated traditional manual processes through computer controlled equipment. As a result, manual effort was replaced by mental effort and individual performance became more difficult to measure. These effects are only touched upon in the current version of the formal model and deserve further study.

4. A MODEL OF THE INITIATIVE - COORDINATION TRADE-OFF

4.1 Basic Setup

The model considers two risk-neutral units (j = A, B; superscript). These units can be thought of as entrepreneurs allocating their effort or as businesses allocating their resources (effort will be used to mean both, unless otherwise noted)13. The units must choose between two tasks (i = 1,2; subscript). The effort allocations are written as vectors

eA = (e1Ae2A) and  eD = (elB/e2B)

The cost of effort is assumed to be convex and for simplicity is given by

c(ej) = l/2.(e1j + e2j- E0)2  for j = A,B

where E0 is a minimal effort level. In the resource interpretation, E0 might be a fixed capacity below which cost is constant.

The purpose of exerting effort and allocating it to the tasks is to obtain two types of benefits

  • Benefits from Initiative
    The benefits from initiative depend on the level of effort in the tasks and are denoted by pij with the vector notation pj = (e1j, e2j) for j = A, B. The total benefit from initiative is given by
    R1 = R1A + R1B = pA • eA + pB • eB

  • Benefits from Coordination
    The benefits from coordination depend on the allocation of efforts to tasks. A rather extreme form of coordination benefits is assumed: coordination benefits arise only when both units exert their entire effort on the same task. This assumption ensures that benefits from coordination and benefits from initiative can be easily separated in the interpretation of the results. The coordination benefits are denoted by m = {m1, m2) and the total coordination benefit is given by
    Rc=m.I(eA,eB) where
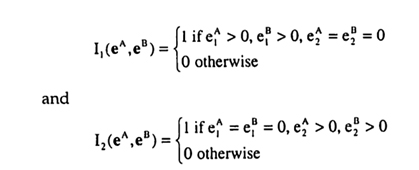
14 The basic setup is a one-shot setting. See Section 4.5 for a discussion of the effects of repetition.

The total benefit is then simply the sum of the benefit from initiative and the benefit from coordination:

R = R1 + Rc

It depends on the benefit parameters pA, pB and m and on the effort choices eA and eB.

Some of the benefits are realizations of random variables. To simplify the analysis, it is assumed that the benefits related to task 2, i.e. p2A, p2B, and m2 are fixed. Only the benefits related to task 1 are uncertain, as follows:

- the p1j are assumed to be distributed uniformly over [Lj, Hj] for j = A, B throughout
- various distributions for m, will be considered, but generally it will be assumed to be distributed uniformly over [LM, HM]

Unless stated otherwise, it will be assumed that Lj < p2j < Hj and similarly that LM < m2 < HM. All realizations are assumed to be independent of each other and across time.

4.2 Overview of the Analysis

This basic setup will be analyzed for a number of different assumptions about incentives and information. It functions much like a laboratory in which it is possible to conduct a variety of experiments. For incentives, two fundamental scenarios will be distinguished. In the team theory scenario, it is assumed that agents' incentives are aligned so that they will maximize the total benefit. In contrast, in the incentive scenario, it is assumed that agents maximize their individual benefits. The team theory scenario will be analyzed first and will provide a benchmark for comparison. 14

14 To the best of my knowledge there are no other papers that analyze several substantially different IT settings from both a team-theory and an incentive perspective.

Throughout, it will be assumed that the benefits from initiative are observed locally in the units, i.e. unit A observes pA and unit B observes pB. The benefits from coordination, m, are generally assumed to be observed by a central unit. Occasionally, it will also be discussed how the results would differ if the benefits from coordination were observed locally (e.g. if unit A observed and unit B observed m2). All observations occur before the units need to choose their effort levels and are realizations of random variables, as was described above. The availability and usage of IT determines how much of this information can be communicated between the units before efforts need to be chosen. Three settings will be distinguished, which coarsely reflect the evolution of IT, where IT is interpreted broadly to include both computation and communication.

  • No IT
    Without IT, communication is prohibitively slow and costly and hence the units must base their effort choices solely on their local observations of realizations and on the knowledge of the distributions of the variables. 15
  • Centralized IT
  • In the centralized IT setting, the local units can communicate the realizations pA and pB of the benefits from initiative to the center. The center thus has access to all information, including the realization m of the benefits from coordination. But the local units have limited computational power. Therefore, instead of being able to send all the information to the local units and letting them compute the optimal decision, the center must carry out the computation. The essence of such central computations is that they take a large number of inputs and reduce them to a few outputs. In order to avoid modeling difficulties, the output is assumed to be restricted to a single bit.16 This should not be seen as an asymmetry in the communication channel, but rather be compared to the information available to the respective sender: the local units send most (here: all) of their information, whereas the center carries out a computation and sends only the result.
15 This does not imply that communication is impossible; it is merely too slow and costly for the type of repeated observation and reaction considered here.
16 If the output were a real number, the center could potentially give highly sophisticated commands, which would be difficult to model. This problem is closely related to the information coding problem discussed in a separate paper (Wenger 1997a).
  • Networked IT
    Finally, with networked IT it is possible to share all observations. The units A and B can thus base their choice of efforts on a complete knowledge of all the benefits pA, pB, and m. The assumption here is that not only do high-speed networks make it possible to communicate all information, but there is also enough local computing power available to make use of it.

These assumptions about IT express capabilities only.17 Whether or not the units actually use these capabilities to truthfully report their observations is a separate issue. Truthtelling will be assumed for the team theory scenario but not for the incentive scenario.

4.3 Team Theory Scenario

4.3.1 Measures for Comparison

In order to have a unified way for comparing the results in the different settings and scenarios, it will be useful to introduce the following two measures:

  • Degree of Coordination
    Coordination will be said to occur when the units deviate from their locally optimal choice in order to obtain the coordination benefit.18 With perfect coordination the units only deviate when doing so is in fact optimal. There are three possible errors: deviation when it is not optimal (over-coordination); no deviation when it would be optimal (under-coordination); and wrong deviation (mis-coordination).19 The degree of coordination will therefore be the percentage of realizations of p1^, p1A and ml for which no coordination errors are made.
  • Degree of Initiative
    Initiative is the effort undertaken by the units. In order to separate its measurement from the measurement of coordination, the effort will be considered conditional on the choice of tasks. This is easiest by considering task 2 only, since for task 2 the benefit from initiative is fixed by assumption. The degree of initiative will therefore be the percentage of effort that is expended relative to the social optimum when task 2 is chosen.
17 The approach taken here is different from Malone and Wyner (1996). Their paper represents three organizational forms by reduced expressions that include both the cost and benefits from IT. The current paper, however, changes only the IT setting and treats the organizational form as endogenous.
18 This may appear to be an awkward definition, but its utility in measuring coordination will become apparent during the analysis.
19 For an example of mis-coordination consider the following: the locally optimal choices are task 2 for unit A and task 1 for unit 13; taking coordination into account, it would be optimal for both to choose task 2, yet they wind up both choosing task 1. They do coordinate, i.e. unit A deviates from the locally optimal task, but unit B should have been the one to deviate.

Both measures range between 0 and 100%. The rationale behind the particular choices of measures will become clearer as they are used below to compare various settings in the different scenarios.

4.3.2 Networked IT (Team Theory Scenario)

The Networked IT setting is the easiest to analyze since here all information can be communicated. With costless communication, it is always optimal in a team theory setting to actually communicate all the information (Marschak and Radner 1972). The team members can then each solve the overall optimization problem and locally make their choices according to this socially optimal solution. The Networked IT setting in the team theory scenario also provides a natural base for comparison. All other situations involve some type of constraint on the available information, the incentives, or both.

The decision rule for the Networked IT setting can be derived as follows. Given the assumptions, it is never optimal for a local unit (A or B) to split its effort between the two tasks. Suppose splitting were optimal. This would result in

Rc = m • I(eA eB) = (m1, m2)' • (0,0) = 0

But with no benefit from coordination, the benefit from initiative can be maximized freely (there can be no loss of coordination benefit). Since the benefit from initiative is linear by assumption, it is optimal for each unit to allocate all effort to the task with the higher benefit. Hence, splitting could not have been optimal.

With splitting ruled out, the decision rule consists of comparing the total benefit from four different possible optimizations (depending on which tasks are chosen, as indicated in the first two columns):

A B Optimization
1
1
2
2
1
2
1
2
max p1A . e1A + p1B . e1B + m1 - 1/2(e1A - E0)2 - 1/2(e1B - E0)2
max p1A . e1A + p2B . e2B - 1/2(e1A - E0)2 - 1/2(e2B - E0)2
max p2A . e2A + p1B . e1B - 1/2(e2A - E0)2 - 1/2(e1B - E0)2
max p2A . e2A + p2B . e2B + m2 - 1/2(e2A - E0)2 - 1/2(e2B - E0)2

As can easily be seen, all four of these optimizations are completely separable into an optimization for unit A and one for unit B. Each of the smaller problems is of the form

max p1j • eej - 1/2 (e1j-E0)2   for i = 1,2 and j = A, B

with the solution

e1j* = p1j + E0 for i = 1,2 and j = A, B

The socially optimal effort choice for task 2, e2j*, will later be used to compute the degree of initiative. It is now straightforward to determine the optimized values and compare them in order to determine the optimal choice of tasks.

Given the assumptions about the structure of the uncertainty, there is a convenient way of graphing the resulting decision rule. For a given realization of m, the optimal choice of tasks can be graphed as a phase diagram in (p1A, p1B) space, since p2A, p2B, and m2 are fixed by assumption. The shape of the phase diagram is derived in Appendix A and shown in Figure 1.

The notation (A, B) indicates the tasks to which the units should optimally allocate their effort for each region of the phase diagram. It is important to note, that while the shape of the diagram is always the same, the exact size of the regions depends on the benefit from coordination. With m2 fixed by assumption, the size depends on the realization of m1 As is shown in Appendix Al, for m1 = m2, the curve separating the (1,1) and (2,2) regions passes right through the point (p2A, p2B). For m1 > m2, the curve passes below the point and for m1 < m2, the curve passes above it.

Using this phase diagram, the decision rule can be stated in the following way that facilitates the further analysis and clarifies its implications:

Networked IT Decision Rule
  1. Communicate all information. Then determine to which task to allocate effort by drawing the phase diagram for the realization of m{ and seeing in which region the point (p1A, p1B) falls.
  2. Choose the effort level for the correct task according to e1j* = p1j + E0 .

In this formulation, part 1 of the decision rule takes care of coordination, i.e. the choice of task. From the derivation it follows that 100% coordination is achieved. Part 2 of the decision rule determines initiative, i.e. the degree of effort. Again, it follows from the derivation that 100% initiative is achieved.

As will be seen shortly, in the team theory scenario, changes in the IT setting affect only part 1 of this decision rule and hence the degree of coordination. Part 2 remains the same and hence there is always 100% initiative. This separability is not really a result, since it was built in by assuming that the coordination benefit is independent of the level of effort. The reason for making this assumption is to clarify the source of the tradeoff between initiative and coordination: In the incentive scenario, separability breaks down, and a tradeoff between initiative and coordination exists.

Another implication of the decision rule for Networked IT is noteworthy. The central unit's only role is to communicate its observation of the benefits from coordination. The central unit is not required for decision making, since the required decision-making can take place in a decentralized fashion in the local units. Therefore if unit A were to observe ml and unit B were to "observe" m2 (it is assumed to be fixed), or the other way round, there would be no role at all for a central unit.

4.3.3 Centralized IT (Team Theory Scenario)

With Centralized IT, the central unit can obtain all information: it observes the realization m of the benefits from coordination and the local units A and B can communicate their respective benefits from initiative, pA and pB, to the center. The central unit can now draw the phase diagram and determine the optimal choice of tasks. It can then use the two single bits to communicate the task choice back to the units, e.g. bitj = 0 means "choose task 1" and bitj = 1 means "choose task 2" (for j = A, B). This is summarized in the following decision rule:

Centralized IT Decision Rule
  1. Communicate local observation to the center, which will send back the correct task.
  2. Choose the effort level for the correct task according to e1j* = p1j + E0.

In the team theory scenario, Centralized IT can thus achieve exactly the same outcome as Networked IT, i.e. 100% coordination and 100% initiative. Now, however, the central unit plays a crucial role, since it actually chooses the correct tasks. Once each local unit has received its central command, it can choose the optimal effort level, since this only requires it to know the benefit from initiative which it has observed locally. Again, the analysis would not change much if the benefits from coordination were also observed locally.

4.3.4 No IT (Team Theory Scenario)

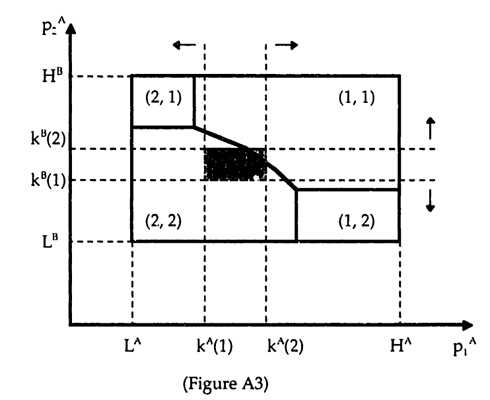
Without IT, the units must base their choice of tasks solely on their local observation of the benefits from initiative and their knowledge of the distribution of the benefits from coordination. In Appendix A2 it is shown that the following simple decision rule is optimal for this setting:

No IT Decision Rule
  1. If p1j is above the cutoff k1, choose task 1. If it is below the cutoff, choose task 2.
  2. Choose the effort level for the correct task according to e1j* = p1j + E0.

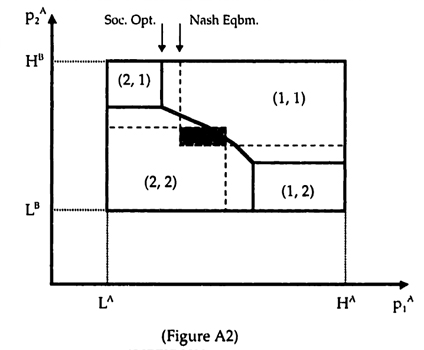
Without IT, it will—in general—no longer be possible to achieve perfect coordination. Consider the following phase diagram which was drawn for a particular (albeit unobserved) realization of m1

The thick lines in Figure 2 mark the areas for the optimal task choices, which are indicated in the four comers. The solid lines at kA and k" determine the four quadrants of actual task choices, whereas the dotted lines at p2A and p2B determine the four quadrants of locally optimal choices. The following table summarizes the choices for each area:

Area Optimal Local Actual Coordination
1 (2,1) (2,1) (2,1) none required
2 (ID (2,1) (2,1) under
3 (l,D (2,1) (1,1) optimal
4 (l, l) (1,1) (1,D none required
5 (2,2) (2,1) (2,1) under
6 (2,2) (2,1) (1,1) mis
7 (2,2) (2,2) (2,1) over
8 (2,2) (2,2) (1,1) over
9 (1,1) (2,2) (1,1) optimal
10 (1,1) (1,2) (1,1) optimal
11 (2,2) (2,2) (2,2) none required
12 (2,2) (2,2) (1,2) over
13 (2,2) (1,2) (1,2) under
14 (1,1) (1,2) (1,2) under
15 (1,2) (1,2) (1,2) none required

As Figure 2 and the summary table show, there are areas in which coordination errors are made. In areas 2,5,13, and 14 coordination would be required but does not take place (under-coordination). In areas 7,8, and 12 coordination is not required but does take place (over-coordination). Finally, in area 6 coordination is required, but the wrong coordination occurs (mis-coordination). Hence the degree of coordination is strictly less than 100%.

The degree of coordination is lowest for "moderate" distributions of the benefits from coordination, i.e. when coordination matters but is not overwhelming. The closer the distribution is to one of two extreme cases, the higher the degree of coordination. The first extreme case occurs when there are no benefits from coordination (m1, = m2 = 0 always). The second extreme case occurs when the benefits from coordination are so overwhelming that a unique choice of tasks (e.g. both units always choosing task 1) is optimal. In both extreme cases 100% coordination can be achieved even without IT.

Without IT, there will be a significant difference if the benefits from coordination are observed by the local units. In particular, if unit A were to observe it would condition its cutoff on the observation, i.e. kA(m1). It is easily seen that the cutoff would have to be lower for higher realizations of m1.

4.3.5 Summary of Team Theory Scenario

The analysis of the team theory scenario thus provides a number of important insights.

  • The degree of initiative is 100% for all IT settings.
  • In both the Networked IT and the Centralized IT setting, 100% coordination can be achieved for any distribution of the benefits from coordination.
  • In the No IT setting, coordination degrades, with the degree of coordination being worst, when both initiative and coordination matter.

These insights can be summarized in the following diagram (Figure 3), which will later be used for comparisons to the incentive scenario.

Figure 3 assumes distributions of the parameters for which both the benefits from initiative and the benefits from coordination matter. The dots mark the maximum coordination that can be achieved for each of the IT settings. The dotted lines indicate that in each IT setting it is also possible to have less coordination and/or less initiative, if a non-optimal decision rule were used. For instance, in the No IT setting, if the cutoff in the decision rule is too low or too high there will be less coordination than can be achieved with the optimal cutoff.

In other words, the dotted line is the initiative - coordination frontier for an IT setting. More IT shifts the frontier to the right as indicated by the arrow. Given the definitions of the measures, more initiative and more coordination are desirable. Therefore given the rectangular shape of the frontiers, the uniquely optimal point is as indicated in the top right comer.

4.4 Incentive Scenario

4.4.1 Additional Assumptions

The team theory scenario is built on the premise that all agents will optimize the overall benefit rather than their individual benefits. In most organizational settings this is rather unrealistic. Introducing incentive issues affects the analysis in two major ways. First, agents will choose effort to maximize their own benefit given their incentive scheme. Second, agents will not necessarily truthfully reveal the information available to them but must be given incentives to do so.

The incentives will be based on two measures of the benefit, one for unit A and one for unit B, as follows:

RA = R1A + 0.5 - Rc = pA • eA + 0.5 • m - I(eA, eB)
RB = R1B + 0.5 • Rc = pB • eB + 0.5 • m - I(eA, eB)

It can easily be seen that the two measures sum to the total benefit. The measures reflect the idea that the benefit from coordination cannot be attributed to either unit and is therefore split between them. This could be the result of an allocation rule by the center or the outcome of a bargaining process between the two units. 20

The analysis will be restricted to incentive schemes that are linear in these two measures. The "wages" for the two units thus take the following form:

wA = α0 + αA . RA + αB . RB
wB = β0 + βA . RA + βB . RB

The weights on the two measures will often be referred to as the "commission rates," They should be interpreted as a reduced form representation of a large number of incentive instruments, which include explicit commissions, but also include ownership, subjective performance measures and others.

20 If there were N units then this model would represent a coordination opportunity between any two of them. Alternatively, one could explore the effects of a situation where the coordination benefit is spread across many units.

Focusing on linear schemes is less restrictive than it may at first appear. The units can observe the realizations of at least some of the benefit parameters before making their choices. Therefore they can condition their level of effort on their observations. In such a case, non-linear schemes can result in large distortions, and it has been shown that linear schemes may be optimal (Holmstrom and Milgrom 1987).

The measures also intentionally do not include the cost of effort. If the cost were completely measurable, there would be no incentive problem. By setting the commissions to αA = αB = βA = βB =0.5, each unit would face exactly the same optimization problem as in the team theory scenario (scaled by a constant factor of 0.5, but that of course does not affect the choices). The assumption that cost cannot be measured is readily justifiable when the units are individuals since effort costs are subjective and therefore impossible to measure directly. In the case of businesses allocating resources, the assumption may appear less justified since one might argue that accounting cost could be used. This would, however, not be appropriate for two reasons. First, the units are likely to have many activities (aside from the ones modeled), and hence their accounting cost is subject to various manipulations, such as the allocation of overhead. Second, the relevant cost concept are opportunity costs, which may diverge widely from the recorded accounting cost even without any manipulation. Third, the cost may reflect additional personal costs or benefits to the managers of the businesses, which are difficult to measure.

4.4.2 Networked IT (Incentive Scenario)

To analyze the Networked IT setting, it will first be assumed that both units truthfully report their information. Note that the revelation principle cannot be applied here since the contracts have been restricted to linear schemes. The remaining incentive problem is then the choice of effort. Consider Unit A's optimization problem, treating Unit B's effort choices as given

max wA - c(eA) =
= max α0 + αA • pA' • eA + (αA + αB) - 0.5 • m'. I(eA, eB) - 0.5(e1A + e2A - E0)2

By the same argument as in the team theory scenario, it is never optimal for Unit A (and hence also for Unit B) to split its effort between the two tasks. Therefore Unit A's optimizations can be reduced to two smaller problems of the form

max αA . piA . eiA- 1/2 (eiA - E0)2 for i=1,2

with the solutions

eiA* = αA . piA + E0 for i = 1,2

The problems and solutions are analogous for unit B.

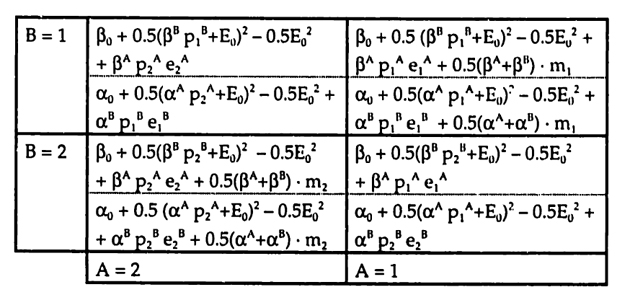
Given these solutions and the fact that neither unit will split its effort between the two tasks, it is straightforward to represent the game played between the two units in normal form (the relevant simplifications are shown in Appendix A3.1). 21

21 The somewhat unusual layout of the normal form was chosen to reflect the orientation of the phase diagram from the team theory scenario.

By inspecting the normal form, it is possible to discern the effects of changes in the various commission rates (see Appendix A3.2 for a more formal analysis, as well as Section 4.5 for a discussion of the effects of repetition):

  • αA and βB
    These commission rates affect all four payoffs for units A and B respectively. But their relative effect is stronger for payoff terms without coordination benefit (i.e. A = 1 / B = 2 and A = 2 / B = 1). Hence decreasing these rates makes the outcomes with coordination benefit more likely. This effect can be understood best by examining the special case of αA = βB = 0.
  • αB and βA
    These commission rates affect only the payoff terms with coordination benefit (i.e. A = 1 / B = 1 and A - 2 / B = 2). Hence increasing these rates makes the outcomes with coordination benefits more likely. This effect can be understood best by starting with αA = βB = 0.5 and αB = βA = - 0.5 and then increasing both αB = βA to 0 or even to positive 0.5.

The commission rates thus have different effects and can be used to guide the game played between the two units.

Two special cases, the individual entrepreneurs and the bureaucracy, will provide additional intuition.

  • αA = βB = 1 and αB = βA = 0
  • These commission rates correspond to the case of individual entrepreneurs who own their respective businesses, They are residual claimants and thus obtain their full benefit, including a 50:50 split of the benefits from coordination as the result of bargaining between them. The first insight is that in this case the conditions for the choice of effort are the same as in the team theory scenario
    eiA* = αA • piA + E0 = piA + E0
    eiB* = βB • piB + E0 = piB + E0
    Hence the degree of effort is the same, i.e. 100%. The second key insight is that the degree of coordination is lower than in the team theory scenario. The intuition is that coordination requires deviations from the locally optimal choice. Since the entrepreneurs obtain the full benefits from initiative but only half the benefits from coordination, they will deviate less frequently from the locally optimal choice than would be necessary for 100% coordination.22
  • αA = αB βA = βB = 0
    These commission rates correspond to the case of bureaucracy. The units have no ownership and do not receive any explicit incentive pay. The combination of the various incentive instruments results in wages that are completely flat, i.e. the individual benefits are fixed. By inspection of the optimization problems from above, it follows immediately that the effort level will drop to E0. The degree of effort is thus less than 100% as long as p2j > 0 for j = A, B
    E0 / (p2j + E0) < 1 if p2j > 0
    Bureaucracy, however, can achieve 100% coordination. The payoffs in the normal form are E02 everywhere and the units are thus indifferent between the choices of tasks.

The two special cases thus fit the intuition that was developed earlier for the tradeoff between initiative and coordination.

The question immediately arises whether it is possible to achieve both 100% initiative and 100% coordination as in the team theory scenario. One might consider giving both units the full benefit by setting αA = αB = 1 and similarly βA = βB = 1. The problem with this solution is that it uses up twice the benefit that is available. In other words, it does not meet the budget constraint of

WA + WB ≤ R

It is only possible to give the full marginal benefit to one of the two units, in which case the other unit will exert minimal effort E0. Any solution that meets the budget constraint cannot achieve both 100% initiative and 100% coordination. It is important to note that this is a result of using continuous schemes. Suppose that all the realizations of the parameters were known in advance.23 Then it would be possible to calculate the maximal benefit and to use a discontinuous incentive scheme which gives nothing to the units unless they achieve the maximal benefit. Such a scheme is known as "budget breaking" and can achieve 100% initiative (Holmstrom 1982). However, as was pointed out above, such discontinuous schemes tend to not work well when the realizations are observed before the actions are taken. The case study section and the section on managerial implications will relate this to the increased use of "stretch targets" and "mission statements" in hybrid organizations.

The budget constraint in combination with the linear incentives thus imposes a tradeoff between initiative and coordination. Characterizing this tradeoff turns out to be rather difficult. If one considers the (p1A, p1B) space, then changes in the commission rates have two effects. First, the rates affect the game played between the two units and thus determine which set of equilibria is possible for given realizations. Second, they also shift the boundaries of the phase diagram for the socially optimal choices, since the commission rates affect the level of effort, This effect is like chasing a moving target: changes to the commission rates influence both how the units will play and how they should play. Because of this complexity, the actual analysis is relegated to Appendix A3 2 and only the results are shown here.

22 This is shown formally in Appendix A3.2.
23 The following argument also works under uncertainty, but onJy to the extent that the agents do not observe the realizations before they take their actions.

As in the team theory scenario, the approach for the analysis is to first take realizations of the benefits from coordination as given. The following figure shows the conditional initiative - coordination frontiers for selected realizations of m1 as colored lines (m2 = 6). Each frontier is the result of varying the commission rates. First αA and βB are chosen between 0 and 1, which fixes the degree of initiative. Then αB and βA are determined to maximize the degree of coordination. The actual frontier is found as an average across all realizations and is indicated as a solid black line.
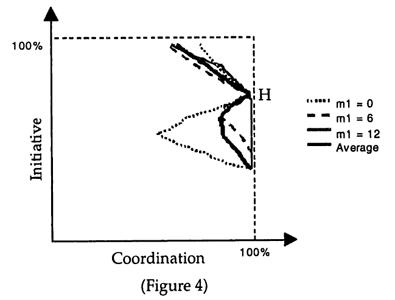
Figure 4 provides some important insights into the organizational implications of Networked IT.

  • First, for every realization it is possible to achieve close to 100% coordination for a level of initiative that is significantly above the bureaucratic minimum. This is a crucial observation since it helps explain the idea of hybrid organizations. The point where all curves reach almost 100% coordination will be referred to as the "hybrid point" (labeled H in Figure 4). The hybrid point is marked by balanced incentives: each unit's "wage" depends both on its own performance and on the performance of the other unit.

  • Second, one can see clearly that as the degree of initiative rises above the hybrid point and approaches 100%, the degree of coordination degrades. The degradation is strongest when the coordination benefit is the same for both tasks (i.e. m1 = m2 = 6), as indicated by the green line. Interestingly, ordination also degrades for levels of initiative below the hybrid point. The error here is over-coordination, i.e. the units deviate too frequently from the local optimum.

  • Third, it is no longer easily possible to determine the optimal point, as was the case in the team theory scenario. Most points below the hybrid point are clearly dominated since they involve both less coordination and less initiative. Above the hybrid point, however, there is an important tradeoff: more initiative implies less coordination. Interestingly, the hybrid point while not necessarily optimal, will be quite good for a large range of situations whereas 100% initiative does quite poorly for some realizations. This stability further increases the appeal of hybrid organizations. While they may not be optimal for any particular situation, they may be close to optimal for a large number of situations and are thus quite robust.

These insights will be explored in more detail below during the discussions of historical and case study evidence and of managerial implications.

The analysis up to this point has assumed that both units will truthfully report their observations. In Appendix A3.3 it is shown that this will not necessarily be the case. It turns out that emphasizing initiative increases the units' incentives to misrepresent their observations. The balanced incentives found in hybrid organizations thus have the added appeal that they encourage the truthful reporting of information. This factor will be even stronger when the units also observe the coordination benefits, i.e. when unit A reports the realization of m1. This suggests an additional insight for the organizational implications of Networked IT: there may be a role for a center in enforcing truthful reporting. Such enforcement may in fact be supported by Networked IT itself, for instance in the form of more detailed audit trails.

4.4.3 Centralized IT (Incentive Scenario)

As in the Networked IT setting, it will at first be assumed that the units truthfully report their observations.24 It is thus still possible for the central unit to determine the optimal choice of tasks. But the local units will no longer necessarily carry out the central unit's command. Instead, the units will again play a game. This game will now be analyzed. The analysis turns out to be surprisingly similar to the analysis of the No IT setting in the team theory scenario, as presented in Appendix A2.

Let лB(MA) denote the probability that unit B will choose task 1, given that unit A has received the message MA = 1,2 from the central unit (note that the actual message is a single bit and hence either 0 or 1). Unit A will choose task 1, when its expecied benefit E[A1] is larger than the expected benefit from task 2. In Appendix A4.1 it is shown that the choices of effort for unit A are determined by

eiA* = αA . piA + E0

and that the difference in expected benefits is

D(p1A, MA) := E[A1] - E[A2] = (αA p1A + E0)2 - (αA p2A + E0)2 +
+(αA + αB) . {лB (MA) E[m1 | MA] - (1-лB(MA)) . m2}

The difference between expected benefits is continuous and strictly increasing in p1A. Hence there exists a cutoff kA(MA) such that for p1A ≥ kA(MA) the difference in expected benefits is non-negative, i.e. D(p1A, MA) ≥ 0, and hence unit A will choose task 1. The logic is analogous for unit B.

24 As before, it is not possible to apply the revelation principle.

Several insights can be gained by inspecting the determination of the cutoffs. As in the Networked IT setting, the commission rates αA and βB affect the importance of both the benefits from initiative and the benefits from coordination. The commission rates αB and βA on the other hand affect only the importance of the benefits from coordination. It follows immediately that more coordination can be achieved when the incentives are more balanced. The two special cases are also very similar to the Networked IT setting.

  • αA = βB = 1 and αB = βA = 0
    For individual entrepreneurs it is again true that the degree of initiative is 100%. This follows immediately from the equations for optimal effort. The degree of coordination, however, will generally be less than 100%. For any realization of p1j > kj(2) unit j = A, B will choose task 1 despite the central unit's message. Again the intuition is that since the entrepreneurs obtain the full benefits from initiative but only half the benefits from coordination, the units will deviate less frequently from the locally optimal choice than would be necessary for 100% coordination.

  • αA = αB = βA = βB = 0
    In the case of bureaucracy it again follows immediately that the effort level will drop to E0 and hence that the degree of effort is less than 100%. Bureaucracy, however, can achieve 100% coordination. The units are now indifferent between the two tasks and hence will follow the central unit's command.

The analysis of the intermediate cases requires a characterization of the equilibrium, which is cumbersome and therefore relegated to Appendix A4.2.
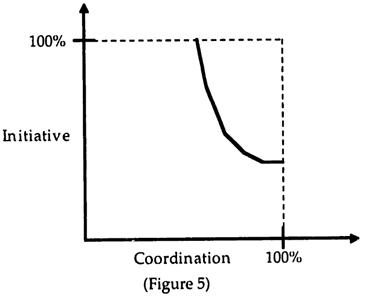
Based on the characterization of the equilibrium from Appendix A4.2 it is possible to give a rough sketch of the initiative - coordination frontier as shown in Figure 5. For high values of αA and βB, initiative is high, but the cutoffs kj(l) and kj(2) are close together resulting in under-coordination. As the incentives become more balanced, the cutoffs move further apart. While this improves coordination, it is not possible to achieve 100% coordination. The achievable degree of coordination depends on the distribution of m,. The stronger the variation in m1 the less coordination can be achieved since the cutoffs are fixed. As the commissions are lowered further, coordination continues to improve as initiative declines. As was shown in Appendix A4.2, the area in which perfect coordination can be achieved grows at an increasing rate, thus explaining the curvature of the frontier. Finally, by setting commissions to 0, it is possible to achieve 100% coordination with minimal initiative.

Figure 5 provides several important insights into the organizational implications of Centralized IT.

  • First, the only way to achieve 100% coordination is by reducing initiative to the minimal level by setting all commissions to zero. This extreme point has previously been interpreted as a bureaucracy with flat wages and no ownership. Centralized IT thus favors a bureaucratic organization when coordination is important.

  • Second, the only way to achieve 100% initiative is with substantially reduced coordination. This extreme point has previously been interpreted as individual entrepreneurs.

  • Third, there is a strong tradeoff between initiative and coordination, i.e. as incentives are increased initiative improves, but coordination degrades. The curvature of the tradeoff suggests that the optimal point is likely to be one of the two extremes of either bureaucracy or individual entrepreneurs.

These insights will be explored in more detail below during the discussions of historical and case study evidence and of managerial implications.

Again, the assumption that the units will truthfully report their observations should be revisited. For the bureaucratic extreme this will obviously be true since the units are indifferent between all the outcomes. However, when initiative is emphasized and especially in the individual entrepreneurs case, the units have an incentive to misrepresent their information. For instance, by over-reporting the realization of p1A, unit A may get the central unit to send out Mj = 1 to both units when for the true realization the messages would have been Mj = 2. Unit A may benefit from this change in messages since it retains 100% of the benefit from its effort, but only 50% of the benefit from coordination. The problem will be especially pronounced when unit A is also in charge of reporting the realization of m1. In addition to processing the information and issuing the messages, the center may thus have to ensure truthful reporting. Note that all of these activities are costly for the center and hence for the individual entrepreneurs case, the central unit will likely have to charge a flat fee, i.e. α0, β0 < 0.

4.4.4 No IT (Incentive Scenario)

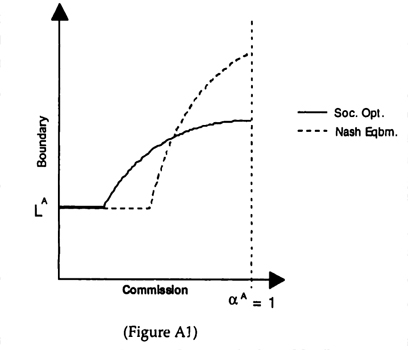
Without IT there is no reporting and hence no assumption about truthfulness needs to be mode. The units play a game based solely on their own observations. In the team theory scenario, the optimal decision rule consisted of a cutoff. The equilibrium of the game played by the units in the incentive scenario will involve a similar cutoff. This follows directly from the analysis of the Centralized IT setting given above. The strategies there were conditioned on a message from the central unit, which resulted in two different cutoffs. Therefore, without a message from the central unit there will be only a single cutoff. The analysis, which is carried out in Appendix A5, thus consists of comparing the socially optimal cutoff with the equilibrium cutoff. The resulting initiative -coordination tradeoff is depicted in Figure 6.
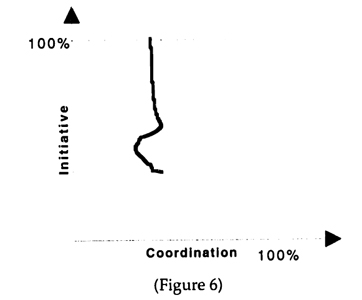
Figure 6 provides several important insights into the organizational implications of No IT.

  • First, without IT it is impossible to achieve 100% coordination. The highest possible coordination is the same as in the team theory scenario, as indicated by the dashed vertical line. Interestingly, this can be achieved at a degree of initiative that is above the bureaucratic minimum.

  • Second, as the degree of initiative approaches 100%, the degree of coordination declines, but only moderately. Even for 100% initiative the degree of coordination is close to the team theory scenario. Hence, while there is a tradeoff between initiative and coordination, it appears likely that the optimal point is at 100% initiative.

These insights will be explored in more detail below during the discussions of historical and case study evidence and of managerial implications.

4.4.5 Summary of Incentive Scenario

The analysis of the incentive scenario thus provides a number of important insights.

  • As the degree of initiative rises towards 100% there is a tradeoff with coordination in all IT settings.

  • IT expands the tradeoff frontier. With Centralized IT, it is possible to achieve both more coordination and more initiative than without IT, and Networked IT expands the frontier even further.

  • The different IT settings favor different organizational forms. Without IT, the individual entrepreneur form is favored. Centralized IT favors a bureaucratic form of organization. Finally, Networked IT favors hybrid organizations.

These insights can be summarized by combining the various tradeoff frontiers into a single diagram (Figure 7).
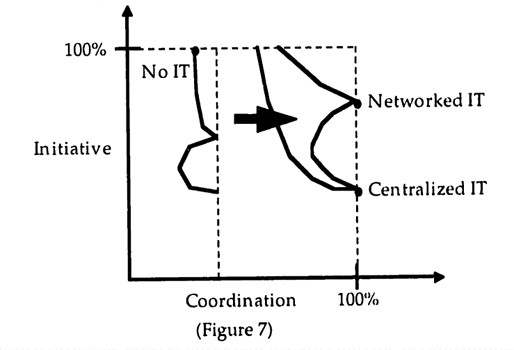
Figure 7 shows how the increased availability of IT expands the tradeoff frontier as indicated by the arrow. The dots indicate the points on the frontier that are favored by the different IT settings. The dashed lines indicate the team theory scenario as depicted in Figure 3. Given the assumptions of the model, the resulting historical evolution of organizations thus proceeds in three stages:

Stage Use of IT Preferred Form of Organization
1 No IT Individual Entrepreneurs
2 Centralized IT Bureaucracy
3 Networked IT Hybrid Organization

This is clearly a highly reduced summary of the analysis. For instance, for certain settings the benefits from initiative may be so important that individual entrepreneurs are the preferred form of organization no matter what the degree of IT use. Nevertheless, the particular pattern of individual entrepreneurs to bureaucracy to hybrid organization should apply to a large number of settings. It has also been identified in work by Malone and Wyner (1996). Sections 5 and 6 present historical and case evidence to support the relevance of this pattern.

4.5 Repetition

The modeling has thus far ignored the issue of repetition. In many organizational settings of interest, the allocation of effort or resources that requires coordination will occur repeatedly. This raises the question how repetition will affect the results of the analysis. For the team theory scenario the answer is simple: repetition has no effect. First, there are no incentive considerations that could be affected. Second, by assumption, the random variables are uniformly distributed and independent across repetitions so that no additional information becomes available.

In the incentive scenario, repetition plays a more important role since it affect the strategies available to the units. Consider the case of networked IT. Suppose further that eventually it will always be revealed whether or not a unit truthfully reported the information that it observed. Then it might be possible to find an equilibrium that achieves both 100% initiative and 100% coordination. The threat of a "grim" strategy of always playing the local optimum, or even intentionally choosing the task that minimizes the other unit's payoff, may suffice to get both units to optimally coordinate and exert the optimal effort.

A detailed analysis of the repeated game is beyond the scope of the current paper but is an important issue for future work.25 It would, however, be surprising if the kind of equilibrium existed that overcomes the coordination-initiative trade-off. Most organizational settings are quite dynamic, thus limiting the frequency of repetition. Career and financial concerns often contribute to an emphasis on short-term results, thus effectively giving individuals and businesses high discount rates. In combination these factors significantly reduce the effectiveness of strategies that rely on future punishment to prevent current deviations. The main expected result from an analysis is thus that repetition will make it possible to sustain higher levels of both coordination and initiative than in the one-shot setting without eliminating the fundamental trade-off.

25 For an interesting related analysis see Baker, Gibbons, and Murphy (1995).

5. Historical Evidence

5.1 Purpose

IT includes technology for both processing and communicating information. When interpreted broadly, IT encompasses such "primitive" technologies as pencil and paper. IT thus has a long history, and its influence should be reflected in historic developments in the design of organizations. This section presents several examples of historic changes and argues that they show a pattern which is consistent with the model analyzed above. While these examples by no means constitute a test of the model, they show how the model provides a useful structure for examining evidence and in turn may strengthen one's belief in its validity.

5.2 Military Organization

Armies have for a long-time been held to belong to the precursors of other large-scale organizations. From early management theorists, such as Fayol (1949), to recent management books (e.g. Dunnigan and Masterson 1997), authors have looked at military organization for insights. Conversely, given its nature (and frequently its funding) the military has often led the adoption of new technologies and thus provides fertile ground for examining their impact.

Consider first the difference between guerrilla troops and traditional armies, as seen recently in the Russian invasion of Afghanistan. Guerrillas generally rely on relatively primitive communication (e.g. handheld radios). They also tend to have little or no heavy equipment, such as tanks or airplanes, that would require significant coordination in order to be effective (e.g. logistics for parts and fuel). Instead, much of their effectiveness depends on the ability to rapidly seize an opportunity for attack and quickly disappear. The guerrillas represent the No IT model of warfare. Small units act more or less on their own and get the full benefit (e.g. in the form of reputation) or downside (e.g. nobody coming to the rescue) of their actions. Traditional armies, on the other hand, represent the Centralized IT model of warfare. They have decision-making centers at the top of a hierarchy, which accumulate information, make decisions, and then pass commands back down. The lower levels carry out the commands and usually have little to no authority to deviate from the commands based on the local situation. Much of the effectiveness of traditional armies depends on the deployment of large troop contingents and the intensive use of heavy equipment, both of which require substantial degrees of coordination.

There is, however, a new model of warfare emerging, which roughly corresponds to the Networked IT setting. While there is still central gathering of information and decision-making, much more information is made available to all levels. This permits troops on the ground to make decisions based on both the local and the overall situation. Operation Desert Storm was a first visible example of this approach (Blackwell 1991; Clancy and Franks Jr. Ret. 1997). For instance, the US forces were using a joint logistics information system, which permitted troops to find out instantly where supplies were (including those in transit). Another system provided real-time location tracking of all deployed troops and equipment, such as tanks and artillery, enabling lower levels to make deployment decisions. This system made it possible to integrate troops from many different nations and to advance quite rapidly.

5.3 Automobile Industry

To this day, automobile production is a significant factor in the economies of several of the leading industrial nations. Many other manufacturing industries have followed patterns observed first in the automotive industry. Given the large fortunes at stake, the automotive industry has also frequently been an early adopter of new technologies. The organization of automobile production is therefore a topic of great interest.26

The early automobile pioneers were often inventors or engineers who set up a small shop to manufacture cars almost completely manually. This craft mode of production heavily emphasized individual skill and initiative. It occurred in essentially a No IT setting, simply because at the time the available means of communication was quite primitive. A major change occurred with the introduction of the assembly line and the shift towards mass production as initiated by Ford. Following the methods of Taylor, work was broken down into tiny steps, and coordination rather than initiative became crucial. This mode of production coincided with improvements in IT, such as the widespread availability of telegraphs and centrex telephones (i.e. within one plant), which resulted in a Centralized IT setting. Information gathering and decision-making was essentially highly centralized. Commands were then issued from the center. In order to be able to issue commands backward in the supply chain, one of two models was generally chosen; Automobile manufacturers were either vertically integrated into parts production or held large inventories of parts.

26 For instance, the study of automobile manufacturing in Womack, Jones, and Roos (1990) is generally credited with having contributed significantly to the diffusion of so-called lean manufacturing techniques to other industries.

The Japanese pioneered a new mode of production, which has become known as lean or modern manufacturing (Womack et al. 1990). This new mode was originally born out of necessity. The Japanese needed to catch up with other nations, which required rapid innovation and thus, given their initially small domestic market, short production runs. The frequent changes ruled out both vertical integration and large inventories as solutions. Instead, the Japanese relied from the beginning on suppliers to create larger components rather than individual parts, and to deliver these just-in-time QIT). An advantage of starting from scratch was that they could co-locate the suppliers and the assemblers. This permitted an intense exchange of information, as in a Networked IT setting, even using relatively primitive forms of IT such as manually transmitted cards.

Today, lean manufacturing is widely diffused and practiced by auto¬mobile producers around the world. It is also tied intimately to intense information sharing, which is generally accomplished through sophisticated computer networks.27 The automotive industry, for instance, pioneered the use of Electronic Data Interchange (EDI). EDI requires that all participants in an industry agree on a standard method of encoding various business transactions into electronic messages. These messages can then be exchanged and processed automatically. In the automotive industry there are many EDI messages that notify suppliers about the planned production so that the suppliers can coordinate their own production schedules in advance.28

27 For an empirical analysis of the relation between the supplier practices associated with lean manufacturing and the degree of information sharing, see Helper and Sako (1995).
28 See the relevant ANSI standards.

6. CASE STUDY EVIDENCE

6.1 Purpose

Case study evidence is a natural complement to historical evidence. Instead of broad trends, a case study focuses on a single firm to illustrate in great detail the richness of organizational design problems. In particular, a case study provides a vehicle for examining a multitude of different design instruments, which in the model were reduced to two commission rates. The effects of other simplifications, such as considering linear schemes only and analyzing games as one-shot, can also be considered.

6.2 Background

The case study draws on evidence that was collected over the course of three years of consulting work for Siemens Nixdorf Informationssysteme (SNI), which is a wholly owned subsidiary of Siemens AG.29 For the 1996 fiscal year, SNI had worldwide revenues of DM 13.6 billion, of which about 60% came from Germany, 30% from the rest of Europe and 10% from the rest of the world. SNI was the result of a merger between the ailing Nixdorf company and the IT unit of Siemens AG in 1990. After the merger, SNI accumulated substantial losses of almost DM 2 billion. In 1994, Gerhard Schulmeyer, an alumnus of MITs Sloan Fellows program and former executive at ABB and Motorola, became the new CEO of SNI and initiated a radical change program aimed at transforming SNI into a hybrid organization that would combine high degrees of both coordination and initiative.

6.3 The Need for a Hybrid Organization

SNI belongs to the shrinking group of surviving "first generation" computer companies. These companies were started in the mainframe era of computing and supply a very broad product-line. On the hardware side, the product line ranges from PCs and Point-of-Sales terminals via mid-range computers to large mainframes and massively parallel computers and also includes printers, other peripherals, and networking equipment. On the software side, the product line ranges from low-level systems software to end-user applications. While some of the products are "pass-throughs," many are produced in-house. In addition to the products, these companies also supply a wide variety of services, including outsourcing, consulting, and systems integration.

29 I am deeply grateful lo Gerhard Schulmeyer, the CEO of SNI, for having provided me with outstanding access to the entire organization and for having taken time on numerous occasions to dicuss the concept of hybrid organizations with me.

The IT marketplace requires extensive initiative. The competition is fierce and the technology is changing rapidly. The changes in technology are frequently not incremental but rather offer completely new solutions. Much of this innovation is driven by new and at least initially more focused companies such as Microsoft and more recently Netscape. Yet there is also a tremendous need for coordination. As more computers are connected to networks, these computers need to be able to work together with other computers. This integration requires compatibility of the systems on both the hardware and software levels. While standards exist that are aimed at ensuring compatibility, in reality systems from a single vendor tend to work together much better than a standards-based integration of systems from multiple vendors.

For instance, IBM is currently the most successful of the "first generation" survivors. The former CEO, Akers, had embarked on a strategy of attempting to break up IBM into completely separate pieces, most likely with the goal of selling some of them. The current CEO, Gerstner, decided instead to keep the company mostly intact (the printer division was spun-off, but IBM has since started producing its own printers again). Similarly, Microsoft, has gradually enlarged its product range to include all types of software (and more recently entertainment). Microsoft has been able to do so based on its widely distributed operating system. Even though Microsoft has published the access standards for much of its software, third party software tends to integrate less well than its own products.30 Even Netscape, which is basing much of its software on completely public standards, is rapidly developing a whole suite of software all optimized to work with each other. Competition in the IT industry thus requires high degrees of both initiative and coordination.

30 For an interesting analysis of the economics of software bundling see Bakos and Brynjolfsson (1997).

6.4 Creating a Networked Organization

6.4.1 Overview

For a company such as SNI, the need to develop a hybrid organization raises at least three important questions. First, how much of the product and service spectrum should be covered inside the firm. Second, what are the design details of a hybrid organization, such as the assignment of decision rights, and the incentive and information systems. Third, how can one transition the company from its present organization to the new form, where organization is to be interpreted broadly as including such "soft" factors as corporate culture.

Strong arguments exist favoring this sequence of the three questions. Reorganizing businesses that one intends to sell or close may be wasted effort. Due to complementarities between design instruments, a partial transition to a new organization may be worse than the old organization. There are, however, also reasons why this sequence may be difficult to implement. For instance, a new CEO may find it difficult to decide which business to keep and which to sell or close without first having an overall strategy. Similarly, the details of the new organization are difficult to design before beginning the transition process. The reality therefore is almost inevitably an iterative process. For clarity, instead of recounting this process chronologically (which would be interesting in its own right), the following is organized around the three key themes of organizational design: the assignment of decision rights (organizational structure); the incentive systems; and the information systems.

6.4.2 Assignment of Decision Rights

The old SNI organization was a traditional hierarchy with many layers. Separate hierarchies existed for the major product and service lines. In addition, SNI had a hierarchy for sales, which was organized by geography. Following are some of the crucial changes to this organizational structure:

  • Smaller and Clearer Units
    Throughout the organization decision rights were rearranged to form smaller and clearer units. The most drastic measure was the introduction of a matrix organization for the sales function, which added a product (service) dimension to the geographic dimension. Each intersection was thus a much smaller unit with a clearly defined responsibility.31 A significant reduction in the number of product and service offerings also created clearer units in the rest of the organization.
  • Flatter Hierarchy
    Continuing previous reorganizations, the hierarchy was flattened further by removing at least one, and in some instances two, levels of middle management, To a large extent this flattening was accomplished by thinning out the product lines.
  • Decentralization
    In general, decision rights were pushed down in the hierarchy. While partially a consequence of flattening the hierarchy, this decentralization was also supported by a new budgeting and review process.32 This process emphasized setting goals for individual units and granting managers more autonomy as long as they met the budgeted goals.

These changes fit the model both directly in how they shift decision-making and indirectly in their incentive implications.

As was seen in the model, in a hybrid organization, decisions can be made by the local units. No central unit is needed to make these decisions and to the extent that the central unit would be congested, the local units would optimally make the decisions. In the case of SNI this decentralization clearly worked belter for some decisions than for others. Decentralization failed in particular for more "fundamental" decisions such as the selection of standards for building internal information systems. These decisions affect many units and their benefits are difficult to quantify. At SNI, there was a danger of different standards being chosen, even though the coordination benefits from choosing the same standard were clearly high.

Second, using the logic from a model by Aghion and Tirole (1994), the changes in organizational structure can be interpreted as increasing the commission rates for individual performance. The flattening of the hierarchy ns well as the explicit rules regarding performance limit the ability of higher level managers to interfere with the activities of their subordinates. The latter can thus keep more of the benefit from their effort. For instance, superiors are less likely to cancel projects or not to accept projects since they now have less information about these projects (both because they have to manage more subordinates and because they know that they cannot intervene if progress is smooth). Through this indirect effect, the changes in organizational structure increase the incentives for individual effort and thus emphasize initiative.

31 As a result, the average size of a unit in sales declined from more than 1,000 employees to approximately 200 employees.
32
In a process called "baselining," each unit had to develop a zero-based budget.

6.4.3 Incentive Systems

Incentive systems are a very broad theme and the following is an attempt to highlight some of the most interesting changes. In the old SNI organization, most non-sales managers received essentially flat wages and even promotions had a significant seniority component.

  • Significant Variable Pay Component
    Most of the old top management team was gradually replaced. All of the new hires have significant variable pay components.33 As these new hires in turn began to replace some of their subordinates, they also introduced stronger variable pay components. The bonuses are not exactly linear, but they are also not highly non-linear. They did initially, however, depend only on the performance of the particular unit.
  • Performance-Based Promotion
    The many positions that had to be filled by new managers created ample of opportunity for promotions. In addition, many change-related projects were started, which required team leaders. In both cases intense internal searches for "high performers" were conducted. With the company finally growing again, performance-based promotions now form an important part of the incentive system. Given the smaller and clearer units, performance can be attributed more easily to individuals.
  • Corporate Culture
    A large number of projects was devoted to changes in the corporate culture. These ranged from so-called "Friday Forums" for fostering open dialog between employees and managers to changes in key processes with an emphasis on increased customer service and speed. The overall goal of the "Culture Change" program was to help create a corporate culture that would emphasize informal and horizontal cooperation and action over waiting for hierarchical decisions.
33 On the order of 20-30% of compensation, which is very high by German standards.

In sum, the new incentive system was initially tilted strongly towards individual performance and thus over-emphasized initiative at the cost of coordination. The effects of higher variable pay and promotions based on individual incentives by far outweighed the "softer" culture change approach.

This imbalance had two effects. First, as was desired, initiative increased significantly. As one indication, SNI's revenue began to grow again after several years of decline. Second, coordination was lacking. For instance, many units launched their own Internet initiatives. Given SNI's overall situation at the time, it appears that initiative was more important than coordination. Since then, however, the problems from under-coordination have grown, especially as SNI is attempting to expand its coordination-intensive outsourcing and systems-integration businesses. A recent project which surveyed the degree to which SNI has become a hybrid organization singled out the imbalance in incentives as the biggest obstacle to coordination.

An apparently important component of incentive systems in hybrid organizations are mission statements which set "stretch" targets. SNI's new mission statement fits this pattern. For instance, the SNI mission is to achieve a geographic sales mix of 1/3 Germany, 1/3 rest of Europe, and 1/3 rest of world by the year 2000. Given the current mix34 and the need to maintain revenues in Germany, this goal requires enormous revenue growth in the rest of Europe and especially in non-European regions, such as Asia and the Americas. The sales mix goal can be interpreted as a type of "budget-breaking" incentive scheme, since achieving this targets requires all units to "stretch," i.e. to exert extra effort. One might argue that a mission statement that is not linked to monetary incentives will not have any incentive effects, but that reasoning would ignore an important aspect of mission statements. They constitute a benchmark for the performance of the overall management team as seen by the supervisory board and the public. As such, not achieving a widely promoted mission will result in a significant loss of credibility with potentially severe negative career implications.

34 Germany: Europe: Rest-of-World is currently 60:30:10 (see above).

6.4.4 Information Systems

Initially SNI was suffering from the "cobbler's children" syndrome, i.e. several of the in-house information systems were considerably less effective than those installed for customers. In particular, SNI was lacking in the use of e-mail, with only a small fraction of the employees having their own access. Furthermore, SNI was using outdated software for its accounting and other financial systems. Key changes included the following.

  • Aggressive Rollout of E-Mail
    Within less than a year, SNI increased its e-mail usage from only a few employees to 70% of its employees. Their goal is to extend e-mail access to 90% of the employees. E-mail is now being used intensively in conjunction with the internal Web sites as a means of communication.35
  • External and Internal Web Sites
    From having virtually no presence in the Web, SNI developed one of the most extensive sites of any computer company, promoting and selling its products and services. A significant part of the site is for internal use only (Intranet) and is used as an important tool for sharing information across the enterprise.
  • New Accounting and Financial Software
    SNI embarked on a complete overhaul of its accounting and financial systems, creating one of the largest installations of SAP software. An important goal is the ability to support complete profit and loss statements for each of the Qmall units in the new organizational structure.

With the updated IT infrastructure, SNI approaches the type of information exchange capability assumed in the Networked IT settings.

The investments in IT infrastructure needed to be decided centrally. Without several central decisions, SNI would have significantly underinvested and incompatible or only partially compatible systems would have been installed. But according to a recent internal review, even the new systems are underutilized. The review attributed the low usage to the strong emphasis on individual performance in the incentive system, which resulted in managers not taking the time to make their information available on the relevant systems. But there was also some fundamental disagreement internally as to who should have access to what type of information. In particular, for the new financial system there were some who believed that unit managers should have access only to the results of their own unit and not to those of others, This issue remains unresolved.

35 There are more than 100 Intranet servers, serving tens of thousands of pages daily.

6.5 Summary

The case of SNI offers several interesting insights into the reality of hybrid organizations:

  • Even though hybrid organizations are complicated, they may be required to compete successfully in industries such as IT, which require both a high degree of initiative and coordination.
  • Changing an existing hierarchical organization into a hybrid organization poses many additional challenges.
  • Smaller units serve a dual role: they facilitate the decentralization of decision making and encourage initiative.
  • "Hard" incentives, such as variable pay and promotions, tend to overpower "soft" incentives, such as corporate culture, in determining behavior.
  • IT infrastructure decisions do not lend themselves to decentralized decision-making. The usage of information exchange capabilities is tied closely to the incentives.

Most of these insights fit well with the implications of the model developed above.

7. MANAGERIAL IMPLICATIONS

7.1 Relevance

The model presented above together with the various forms of evidence (anecdotal, historical, case study), suggest that hybrid organizations are a real phenomenon that is closely related to the increased availability and use of IT. This conclusion has also been confirmed in conversations with numerous top level managers and CEOs in the course of various consulting projects, as well as in the context of the Sloan School's Initiative on "Inventing the Organizations of the 21st Century." At the same time, all of these managers are coping with the difficulties of actually implementing an organization that achieves both more initiative and more coordination.

7.2 IT in the Hybrid Organization

In the model, the increased availability of IT expands the coordination-initiative frontier. The hybrid organization is favored by the Networked IT setting. Without considering any particular technology, the essence of the Networked IT setting is that all information is available to everyone. While this characterization should not be taken literally, it still conflicts with the way most firms traditionally handle information. In particular, most firms restrict access for managers to operational and financial information to the managers' own units. The access restrictions partially result from previously existing limits in technology and partially from a mode of organization in which having more information is a key source of authority for higher level managers in a traditional hierarchy. These managers will view an open sharing of information as a threat to their position. Making the transition to a more open sharing of information is thus not only a question of technology. It is tightly interlocked with the changes in organizational structure and incentive systems.36

Sharing information also does not imply that all information is constantly delivered to everyone. This approach would rapidly result in information overload. Instead, the power of the latest innovations in IT results from the ability to selectively access information, Again, however, technology is only a part of the solution. Significant human effort is still required to bring information into such a state that tools for selective access can be effective, The whole emerging field of "knowledge management" focuses on this problem. One of the key issues here is the use of standards both on the level of technology and content (e.g. a type of shared language) to facilitate the sharing of information.

The choice of standards and more generally the creation of an IT infrastructure cannot easily be decentralized. At first, this implication might appear to contradict the model, which suggests that in a hybrid organization, the decisions can be made by the local units. But note that in a situation where many different standards are available-all of which have high coordination benefits-there may be genuine disagreement over which standard achieves the higher coordination benefit. In such a situation, a centralized decision can be superior to decentralized decision-making. Furthermore, if some units already have existing systems and need to change and the coordination benefits are widely distributed, underinvestment in a decentralized solution might be severe. There is thus likely to be a role for the central unit in creating the basis for a Networked IT setting.

36 See Orlikowski (1992) for a widely cited case study with supporting evidence.

7.3 Decision Rights in the Hybrid Organization

Creating a hybrid organization can require either a centralization or a decentralization of decision rights depending on the starting point. If the starting point is a set of individually-owned entrepreneurial firms, then forming a hybrid organization will require the centralization of at least some decisions, as was seen in the discussion of IT in the hybrid organization above. This centralization may require a change in ownership in order to concentrate the decision rights in one location. On the other hand, if the starting point is a large firm with a traditional bureaucratic organization, then forming a hybrid organization will require a significant devolution of decision rights to lower levels.

There are two important reasons for making many of the operational decisions at lower levels. First, even in relatively small organizations, the central unit would be overloaded if it was required to make all decisions. This aspect was ignored in the model, since no explicit cost of information processing was included. In addition, the local units will almost always have some information that cannot be communicated even with the best IT, such as information that becomes available at the last second, or tacit knowledge that cannot be captured explicitly. Second, the devolution of decision rights is a way of providing incentives. Having decision rights encourages managers to exert effort since they do not need to be afraid that intervention will make their effort investment useless. For instance, a manager who has the rights to launch a new product (e.g.as long as the budget is met), need not be worried that the product is canceled and the effort voided because of a change in strategy.

7.4 Incentive Systems in the Hybrid Organization

Balanced incentives are the crucial characteristic of hybrid organizations: the utility of managers needs to depend not only on how well their own units perform but also on how well those units perform for which there are potential benefits from coordination. There exists a broad range of incentive instruments, which need to be orchestrated in order to achieve this balance, including "hard" incentives, such as performance-based pay and "soft" incentives, such as corporate culture. The model in combination with the evidence suggest several important implications.

First, monetary incentives can easily outweigh all other incentives. As in the case of SNI, the existing evidence suggests that if monetary incentives are based on individual performance only, it will be quite difficult to achieve balanced incentives, even if all other incentives consider coordination performance.37 This problem has two potential solutions. Either monetary incentives are dropped altogether or they are provided in a more balanced fashion. The latter may be difficult to accomplish for a number of reasons. For instance, finding appropriate measures for the performance of other units that capture both the short-term and long-term benefits from coordination is generally difficult. Similarly, anticipating all the units for which there is a potential for benefits from coordination is hard. One potential way out appears to be the use of stock options. While it has been argued that these are too coarse an instrument since they depend on the performance of all other units, anecdotal evidence suggests that their increased use is in fact tied to the emergence of hybrid organizations.

37 Interesting evidence is provided in Baker (1990).

Second, even "softer" incentives, such as promotions, can lead strongly in the direction of individual performance. Promotions have the potential to include many other factors and in particular how well a manager coordinated with other units. Measuring this coordination, however, requires a carefully designed review process. Without such a process, individual performance will receive almost all the attention since measures of individual performance are usually readily available, whereas measures of coordination require significant collection effort. This requirement applies equally well to the whole notion of a "balanced scorecard" which may not only affect promotions, but also monetary incentives (Kaplan and Norton 1996). Without the necessary attention and effort in actually obtaining some of the other measures, the scorecard will be unbalanced in the direction of individual performance. McKinsey and Co. has an interesting approach to making sure that none of the measures in their performance reviews receive short shrift. Each review includes how well the person being reviewed conducted his or her own reviews.38

Third, corporate culture is an important but frequently misunderstood incentive instrument. Much of what is described as corporate culture are actually behavior patterns that are the response to given incentive and information systems. Put differently, much of corporate culture is a symptom, rather than a cause. For instance, whether or not a corporate culture is "cooperative" rather than "competitive" depends largely on the underlying incentive system. Consequently, trying to change these parts of corporate culture without changing the incentive and information systems is a futile effort. This point was illustrated by some of the experiences made by SNI in the case discussed above. There are, however, parts of corporate culture that are actual instruments. For instance, there can be a "star" culture, which glorifies individual achievements, as opposed to a "team" culture, which de-emphasizes individual achievements. This part of corporate culture is determined by many seemingly small factors, such as the use of praise, and one large but frequently neglected factor: selection. Not every employee fits in any type of corporate culture, and one of the strongest ways of shaping corporate culture is to select only those who do.

Fourth, mission statements containing "stretch" targets may play an important role. These targets are a form of team incentive since they affect the reputation and credibility of the overall management team, which can increase initiative without reducing coordination. In addition, they can also be viewed as part of communicating all the available information. In particular, the targets help to communicate top management's view of where the largest coordination benefits can be achieved.

38 Based on conversations with McKinsey consultants and partners (see also Bartlett 1996).

7.5 Transition to the Hybrid Organization

Many existing organizations face the challenge of transitioning to a hybrid organization. The model and the evidence suggest that doing so requires simultaneous changes in IT, organizational structure, and incentive systems. Changes in only one of these components may actually leave the organization worse off. 39 For instance, investing heavily in IT without adapting the incentive systems and organization structure may deplete a firm's resources without giving it much of a benefit. If it is not feasible to transition the entire organization to the new system at once, then the solution has to be to start with one part of the organization (e.g. a plant or a division). Instead, many organizations attempt to change everywhere and spread their resources too thin. As a result they implement only some components of the overall system and are even worse off than before.

39 A detailed discussion of this transition problem is given in Brynjolfsson and van Alstyne (1996).

8. Studying Hybrid Organizations

This paper is only a small step towards a better understanding of hybrid organizations as a new organizational form. Much more work is required on developing the theory and providing additional evidence. Here are some of the necessary next steps.

The model makes a number of simplifying assumptions which need to be relaxed. It is, for instance, clear that the assumption of linear schemes and the use of one-shot games affect the results. Given the already high complexity of the current analysis, relaxing these assumptions may be best accomplished in one of two extremely different ways: first, by finding a more general formulation of the model that is tractable with more powerful mathematical tools and second, by resorting to a simulation approach. The potential for economic theory to inform the modeling of organizations is at present vastly underutilized.

A particularly useful extension of the present model would be to make explicit some of the more obvious incentive instruments such as ownership. 40 This extension would make it possible to examine whether the interpretation of the commission rates given here really holds up. In the case of ownership, the individual entrepreneurship case would require that each of the units owns its assets, while in a bureaucracy, all ownership should be with the central unit. The interesting question then would be under what circumstances hybrid organizations require some type of cross-ownership of assets.

40 This is the approach pursued by Holmstrom and Milgrom (1994), Their paper examines the joint determination of a wide variety of incentive instruments, but they consider a situation in which hybrid organizations do not appear to be optimal.

Additional case studies may provide interesting evidence that can help to further refine the modeling. Conversely, having a first model and its implications can inform new case studies. In particular, the model highlights the interplay between changes in IT and changes in incentive systems as well as organizational structure. Few case studies exist, which cover all three of these elements in sufficient depth to examine this interplay in a real situation.

The model can eventually provide the basis for rigorous empirical work in the form of testable hypotheses. For this purpose, it is first necessary to explore in greater detail the comparative results of the model, for instance, by varying the distribution of benefits from coordination. One could then collect information on a large number of organizations and their environments to test whether their rough organizational form fits the model (for some initial work in this direction, see Brynjolfsson and Hitt (1996)). This approach is likely to be best suited for testing the difference between bureaucratic and hybrid organizations since entrepreneurial organizations are likely to be in a different size class altogether. Another, more indirect approach might be to consider different industries and use indicators of organizational form such as firm size to test the implications of the model. 41

The IT revolution provides a wonderful opportunity to hone and test the economic theory of organization. The improvements in IT can be considered a force that is essentially exogenous and drastically relaxes some of the key constraints on organizational design. The resulting changes offer a unique view of how these constraints contribute to the determination of organizational forms. One of the results has been the emergence of hybrid organizations. A better understanding of these new forms and the historic changes that preceded them also holds the promise of a better understanding of what lies ahead as the IT revolution continues to unfold.

41 See the paper on "IT and Firm Size" (Wenger 1997b) for related evidence.

Appendix

A1. Phase Diagram for Team Theory Scenario

The first step to creating the phase diagram is to carry out the optimizations for the four different effort allocations. This is straightforward and results in

A B Optimized Benefit
1 1 R(1, 1) = f(p1A) + f(p1B) + m1
1 2 R(1, 2) = f(p1A) + f(p2B)
2 1 R(2,1) = f(p2A) + f(p1B)
2 2 R(2, 2) = f(p2A) + f(p2B) + m2

Where

f(pij) =1/2(pij + E0)2 - 1/2 E02

and the notation R(A, B) denotes the total benefit for a given choice of tasks. The region in which R(A, B) is maximal will be referred to, for short, as the R(A, B) region.

The second step is to determine the boundaries of equality between the different regions. this task is simplified by noting that the rough layout of the regions can easily be determined: R(1, 1) will be largest when both p1A and p1B are large and hence this region will be in the north-east of the (p1A , p1B) plane. similarly the R(2, 2) region will be in the SW, R(2,1) in the NW, and R(1, 2) in the SE. In addition, it is known that the benefits from coordination will drive a wedge between the R(1, 2) and R(2,1) regions, so that no boundary between the two has to be established. This leaves the following boundaries (the algebra is straightforward and not shown):

To see how the boundaries are connected, one can easily show that the intersections of the horizontal and vertical lines, which enclose the R(l, 2) and R(2,1) regions, are located on the curve defined by (*). By substituting in, one finds that

which demonstrates that the two points are in fact on the curve defined by (*). It can also immediately be seen that for the special case of m1 = m2 = 0, the two intersections are the same and coincide with the point (p2A, p2B).

The third and final step is to characterize the shape of the curve between the R(l, 1) and R(2, 2) regions. By differentiating P1B(p1A) from (*) twice with respect to p1A, one can easily show that the curve is concave. Furthermore, one can check whether the curve passes above or below the point (p2A, p2B). By evaluating (*) one finds that the curve passes through the point for m1 = m2. For m1 > m2, the curve passes below and for m1 < m2, it passes above. This is as expected since for larger m1 the R(l, 1) region is larger, which in turn requires the curve to be further to the South East.

A2. Analysis for No IT Setting in Team Theory Scenario

Let unit B follow an arbitrary decision rule based on the realizations of p/1. From unit A's perspective this can be reduced to a probability nn that unit лB will choose task 1 (and hence task 2 with probability 1 - лB). The total expected benefit now depends on unit A's choice as follows:

E[R1] = лB . {f(p1A) + f(E[p1B | B=1]) + E[m1]} + (1-лB) . {f(p1A) + f(p2B)}
E[R2] = лB . {f(p2A) + f(E[p1B | B=1]) + (1-лB) . {f(p2A) + f(p2B) + m2}

The difference between these expected benefits has several useful features

E[R1] - E[R2] = f(p1A) - f(p2A) + лB . E[m1] - (1-лB) . m2 =: D(p1A)

First, the difference does not depend on the realization of p1B or its conditional expectation and hence can be used as the basis for a decision rule for unit A. Second, the difference is continuous and strictly increasing in p1A since f(.) is a continuous and increasing function. Therefore the cutoff value for the decision rule can be determined as follows:

The cutoff in turn determines the probability лA with which unit A chooses task 1.

An analogous argument can now be made for unit B resulting in a cutoff kB and an implied probability лB.

The question arises whether it is possible to find cutoffs kA and kB (and hence probabilities лA and лB) that are mutually consistent. By inspection D(plA) is continuous and strictly increasing in лB, which implies that the cutoff kA is continuous and weakly decreasing in лB, and hence the probability лB is continuous and weakly increasing in лB. By an analogous argument the reverse is also true, i.e. лB is continuous and weakly increasing in лA. Since both probabilities are constrained to the interval [0,1], the continuity alone suffices to establish the existence of mutually consistent values by an appropriate fixed-point theorem.

A3. Analysis for Networked IT Setting in Incentive Scenario

A3.1 Simplified Normal Form

The normal form can be derived as follows. First, for each of the four possible combinations of task choices the optimization problem is solved for unit A and unit B (the algebra is straightforward and not shown). This results in the following normal form:

This normal form can be simplified significantly by dropping terms that are irrelevant for the units' choices of tasks. The constant terms α0, β0 and the 0.5E02 can be dropped immediately since they appear in all four cases. The mixed terms of the form αB p1B e1B and βA p1A e1A are a bit more difficult since they appear in only some cases. To see that these terms can be eliminated, one needs to hold one unit's choice constant and then compare the other unit's choices. For instance, if unit B chooses task 1 (top row), then the term αB p1B e1B appears both when unit A chooses task 1 (right column) and when it chooses task 2 (left column). Hence the term is irrelevant for the choice. Having dropped these terms, all remaining expressions can be multiplied by two to eliminate the factor 0.5 and obtain the reduced normal form that is used in the text.

A3.2 Derivation of Tradeoff Between Initiative and Coordination

As was pointed out in the text, the commission rates affect both how the units will play the game and how they should play it. The former is a matter of determining the relevant Nash Equilibria, whereas the latter requires finding the socially optimal outcomes. As before, the notation R(2,1) will be used to denote the region in which it is socially optimal for unit A to choose task 2 and for unit B to choose task 1. The new notation NE(2,1) denotes the region in which the same choices form a Nash Equilibrium. The analysis will be shown in some detail for the comparison of the boundary between the R(l, 1) and R(2,1) regions to the boundary between the NE(1,1) and NE(2,1) regions. The analysis for the other boundaries is analogous and discussed only when needed. The analysis focuses on pure strategy equilibria: mixed strategy equilibria can never fully coincide with the socially optimal choices because the latter are always definite.

First consider the boundary between the socially optimal regions. While this was derived above for the team theory scenario, it now has to be redone for the more general case where the efforts may be below the optimal level. The net social benefits are given by

R(1,1) = p1AAp1A + E0) + p1B(βBp1B + E0) + m1 - 0.5(αAp1A)2
R(2,1) = p2AAp2A + E0) + p1BBp1B + E0) - 0.5(αAp2A)2 - 0.5(αAp1A)2

And hence the boundary is determined by

R(1,1) = R(2,1)
A - 0.5 (αA)2] [(p1A)2 - (p2A)2] + E0 (p1A - p2A) + m1 = 0 (*)

Even without explicitly solving, a number of characteristics of the boundary can be found by inspection of (*). First, the boundary is a vertical line since (*) does not contain p1B. Second, the boundary is to the left of p2A, because that is the only way the left hand side of (*) can be zero. Third, since the first factor is increasing in αA, it must be the case that the boundary moves further to the left, away from p2A, when αA is lowered. The location of the boundary is not affected by changes in aB. Using the quadratic formula, one can solve explicitly for the location of the boundary.

Now consider the boundary between the Nash Equilibrium areas. For this purpose, a deviation by unit A is considered. NEA(1,1) is used to denote the (reduced) payoff to unit A. The payoffs are taken from the table in the text.

NEA(1,1) = (αA p1A + E0)2 + (αAαB) - m1
NEA(2,l) = (αAp2A + E0)2

The boundary is thus determined by

NEA(1,1) = NEA(2,l)
A p1A + E0)2 - (αA p2A + E0)2 + (αAB) • m1 = 0 (**)

Again, the key properties of the boundary can be derived by inspection from (**) without considering the explicit solution. The first two properties are the same as above: the boundary is a vertical line to the left of p2A. Its behavior with respect to changes in aA is harder to see directly. Suppose that when αA is lowered, au is increased to offset the change so that αA + αB = 1. For this type of change, which makes the commissions more balanced, the boundary will move left. As before, it is straightforward to solve explicitly for the boundary.

With both boundaries moving left, it might appear that coordination cannot be improved even by balancing the incentives, i.e. reducing αA and βA and increasing αA and βA. This is, however, not the case because the Nash Equilibrium boundary shifts to the left much faster than the socially optimal boundary. Furthermore, the NE boundary starts out to the right of the socially optimal boundary for αA = 1 and ends up to its left for αA close to 0 (note that for both boundaries there is a discontinuity at αA = 0). While this result can be shown analytically from the explicit solutions, it is easy to see in a graph such as Figure Al which shows how both boundaries change with αA, where αB is adjusted to keep αA + αB = l.

As can be seen from Figure Al, there exists an αA > 0 such that the two boundaries coincide. One might conclude that it is possible to achieve 100% coordination even without reducing initiative all the way to the bureaucracy level. This is, however, a mistaken conclusion since there are additional boundaries which all need to coincide to get 100% coordination. Figure A2 shows all the regions and boundaries with blue indicating the social optimum and red the Nash Equilibria. The two arrows mark the boundaries that were graphed in Figure Al. The other boundaries move in an analogous fashion.

Figure A2 is drawn for high values of αA and βA, which results in several areas of under-coordination. As the commissions become more balanced, a point is reached at which almost 100% coordination can be achieved. It is, however, not generally possible to make all four boundary pairs overlap simultaneously. When the commissions are further reduced, over-coordination results since now the units will depart from the local optimum even when they should not. In particular, the units will play the equilibria (1,1) and (2,2) too frequently. These results are summarized in the initiative - coordination tradeoff charts which are shown in the main text.

A3.3 Truthful Reporting of Observations

Figure A2 also shows a shaded area with two possible pure strategy Nash Equilibria. It easy to show either analytically or through numeric examples that the two units may prefer different equilibria. Such diverging preferences are more likely for higher commission rates αA and βB. In that case a unit may try to force the choice of its preferred equilibrium by misrepresenting its observation. This effect is best seen by examining the simplified normal form of the game played between the two units (see Appendix A3.1).

Consider unit A, which observes the realization of p1A. Reporting a different number than was actually observed affects only the perceived payoffs for unit A. The perceived payoffs for unit B are unaffected. Nevertheless, the outcome of the game may change. For instance, if unit A were to report a high number for p1A, this would lead unit B to believe that unit A will choose task 1 no matter which task unit B chooses, i.e. task 1 will appear as a dominant strategy for unit A. This belief may in turn affect unit B's task choice. It can easily be seen that when task 1 appears dominant for unit A, the only possible change is for B to want to choose task 1 instead of task 2.

It follows that unit A has an incentive to over-report the realization of p1A when both A = 1 / B = 1 and A = 2 / B = 2 are Nash Equilibria, and its payoffs in the former are higher. With more balanced commissions, the payoffs are determined more by the coordination benefits, which are the same for both units and hence the two units become more likely to prefer the same equilibrium, which is also socially optimal. A similar analysis shows that if unit A also observes (instead of a central unit), then it will sometimes have an incentive to misrepresent its observation in order to induce unit B to choose task 1. Again, more balanced commissions reduce the incentive to misrepresent.

A4. Analysis for Centralized IT Setting in Incentive Scenario

A4.1 Derivation of Cutoffs

The first step in the derivation of the cutoffs is to find expressions for the expected benefits E[A1] when unit A chooses task i = 1, 2

E[A1] = лB(MA) {αA(p1Ae1A + 0.5E[m1|MA]) + αB(p1B E[e1B | MA] + 0.5 E[m1 | MA])}
+ (1-лB(MA)) {αBp1A e1B + αBp2B e2B} + α0 - 0.5(e1A - E0)2

E[A2] = лB(MA) {αAp2Ae2A + αBp1BE{e1B | MA}} +
+ (1-лB(MA)){αA(p2Ae2A + 0.5m2) + αB(p2Be2B + 0.5m2)} +
+ α0 - 0.5(e1A - E0)2

By taking the first order conditions with respect to e1A and e2A respectively one finds that the effort choice is determined by

e1A* = αA. p1A + E0

Substituting back into the expected benefits and simplifying the difference results in the following expression:

D (p1A, MA) := E[A1] - E[A2] = (αAp1A + E0)2 - (αAp2A + E0)2 +
+ (αA + αB) . {лB(MA) E [m1 | MA] - (1-лB (MA)) . m2 }

This difference between expected benefits is continuous and strictly increasing in p1A. Hence there exists a cutoff value above which D(p1A, MA) ≥ 0 and unit A will choose task 1. The cutoff is given by

Analogous expressions can be derived for D(p1B, MB) and kB(MB).

A4.2 Characterization of Equilibrium

The units essentially play a game with a correlated equilibrium, with the message from the center providing the correlation device. In equilibrium the cutoffs and the probabilities must be mutually consistent between the two units. This is expressed by the following conditions

Using these equilibrium conditions, it is possible to characterize the location of the cutoffs and how it reacts to changes in the commission rates.

Note that the correlation device is controlled by the central unit. It therefore appears reasonable to impose the following conditions on the equilibrium for j = A, B (where -j denotes the opposite unit)

E[m1 | Mj = 2]  ≤ E[m1]  ≤ E[m1 | Mj =1]
Prob(M-j) = 1 | Mj = 2)  ≤ Prob (M-j =1)  ≤ Prob (M-j = 1 | Mj = 1)

In words, receiving the message Mj = 1 (2) raises (lowers) the conditional expectation of m1 and the conditional probability that the other unit received M-j= 1.

These conditions can be used to show that it is consistent with the equilibrium conditions for the cutoffs to be located as follows:

kj(1) ≤ kj(2) for j=A,B

i.e. the cutoffs are lower for the message Mj = 1. Consider unit A first. Using the condition imposed on the expectations, it follows that D(p1A, 1) ≥ D(p1A, 2) and hence that kA(l) ≤ kA(2) if лB(1) ≥ лB(2). The difference between the two probabilities can be simplified as follows:

The first factor is non-negative by the condition imposed on the probabilities. Therefore, for the expression to be non-negative, it must be that kB(l) ≤ kB(2). Figure A3 shows the cutoffs graphically.

Figure A3 also shows the socially optimal regions for a particular realization of m1. These regions will be different for another realization. The cutoffs, however, are fixed for a given set of commissions. It therefore follows immediately that for any positive commissions, it is impossible to achieve 100% coordination. The question now is how the location of the cutoffs varies with changes in the commissions. Consider a decrease in αA together with an increase in αB to keep αA + αB = 1. Further assume that лB(MA) had been chosen optimally. It then follows by the envelope theorem that D(p1A, MA) will increase if p1A < p2A with higher increases for smaller values of p1A. An increase in D(p1A, MA) in turn decreases kA(MA). Put together, more balanced incentives will decrease (increase) the cutoff if the cutoff was initially smaller (larger) than p2A. This result suggests that for the usually assumed uniform distribution of m1over [LM, HM], with LM < m2 < HM, it will be the case that kA(l) <p2A< kA(2). Hence the lower cutoff will decrease and the higher cutoff increase with more balanced incentives, as indicated by the arrows in Figure A3. These shifts increase the size of the shaded area, which is the area in which perfect coordination can be achieved. In this area the units will follow the central unit's messages for any combination of task choices. The size of the shaded area grows increasingly fast because the cutoffs move faster the further they move out and because the size is a product.

A5. Analysis for No IT Setting in Incentive Scenario

The analysis will compare the socially optimal cutoff with the equilibrium cutoff. Similar to Appendix A2, the socially optimal cutoff for unit A is determined by forming the difference between the expected total benefits. Let лB denote the probability that unit B will choose task 1.

DR(p1A) := E[R1] - E[R2] =
= [αA - 0.5 (αA)2][(p1A)2 - (p2A)2 + E0 (p1A - p2A) + лRB E[m1] - (1-лRB)m2

Similar to Appendix A4.1, the equilibrium cutoff for unit A is determined by forming the difference between the unit's expected benefits.

DA(p1A) := E[A1] - E[A2] =
=(αA p1A + E0)2 - (αA p2A + E0)2 + (αA + αB) {лAB E[m1] - (1-лAB)m2}

The cutoffs in turn translate into probabilities лRA and лAA that unit A will choose task 1. These can then be used to derive cutoffs for unit B. By an argument similar to the one in Appendix A2, it can be shown that there exist mutually consistent cutoffs and hence probabilities for both units.

Now consider DR(p1A) and suppose that the cutoff is smaller than p2A so that at the cutoff p1A < p2A. If лRB has been determined optimally, it follows by the envelope theorem that an increase in αA will result in a decrease in the value of D(p1A) since (1 - αA)[(p1A)2 - (p2A)2] < 0. This in turn implies an increase in the value of the cutoff and hence reduces the probability that unit A will choose task 1. Working through all the resulting changes shows that unit B's cutoff will also increase. A similar chain can be constructed for a change in βB. The same logic can be applied to DA(p1A) to show that the equilibrium cutoffs for both units are also increasing in αA and βB, provided that they are smaller than p2j (note: decreasing if greater).

Finally, it can be shown that the equilibrium cutoffs move faster than the socially optimal cutoffs. Hence, much like in the case of Networked IT (see Appendix A3.2) there exist commission rates for which the cutoffs for both units roughly coincide and hence the degree of coordination is close to socially optimal. All of these analytical results can be shown without explicitly solving for the equilibrium, which turns out to be difficult. Instead of an explicit solution, the tradeoff frontier shown in the text was found by numerically determining the equilibrium probabilities and cutoffs.

REFERENCES

Aghion, Philippe and Jean Tirole (1994): "Formal and Real Authority in Organizations” mimeo.
Baker, George (1990): "Pay-for-Performance for Middle Managers: Causes and Consequences” Journal of Applied Corporate Finance 3(3).
Baker, George, Robert Gibbons, and Kevin Murphy (1995): "Implicit Contracts and the Theory of the Firm." mimeo.
Bakos, Yannis and Erik Brynjolfsson (1997): "How to make a bundle." mimeo.
Bartlett, Christopher (1996): "McKinsey & Co: Managing Knowledge and Learning," Harvard Business School Case.
Bartlett, Christopher A. and Sumantra Ghoshal (1990): "Matrix Management: Not a Structure, a Frame of Mind." Harvard Business Review (July-August), pp. 138-145.
Blackwell, James (1991): Thunder on the Desert: The Strategy and Tactics of the Persion Gulf War. New York: Bantam Books.
Brynjolfsson, Erik and Lorin Hitt (1996): "IT and Organizational Architecture." mimeo.
Brynjolfsson, Erik and Marshall van Alstyne (1996): "Matrix of Change." mimeo.
Byrne, John A. (1993): "The Horizontal Corporation." BusinessWeek.
Clancy, Tom and General Fred Franks Jr. (Ret.) (1997): Into the Storm: A Study in Command. New York: G. P. Putnam's Sons.
Davenport, Thomas H. (1993): Process Innovation: Reengineering Work Through Information Technology. Cambridge: Harvard Business School Press.
Dunnigan, James and Daniel Masterson (1997): The Way of the Warrior: Business Tactics and Techniques from History's Twelve Greatest Generals. New York: St. Martin's Press.
Fayol, Henri (1949): General and Industrial Management. Translated by Constance Storrs. London: Pitman.
Hammer, M. and J. Champy (1993): Reengineering the Corporation: A Manifesto for Business Revolution. Harper Business.
Helper, Susan and Mari Sako (1995): "Supplier Relations in Japan and the Unites States: Are They Converging?" Sloan Management Review (Spring), pp. 77-84.
Holmstrom, Bengt (1982): "Moral Hazard in Teams." Bell Journal of Economics 13(2), pp. 324-40.
Holmstrom, Bengt and Paul Milgrom (1987): "Aggregation and Linearity in the Provision of Intertemporal Incentives." Econometrica 55(2), pp. 303-28.
Holmstrom, Bengt and Paul Milgrom (1994): "The Firm as an Incentive System." American Economic Review 84(4), pp. 972-991.
Kaplan, Robert and David Norton (1996): Balanced Scorecard. Boston: Harvard Business School Press.
Malone, Tom and George Wyner (1996): "Control, Empowerment, and Information Technology." mimeo.
Marschak, Jacob and Roy Radner (1972): Economic Theory of Teams. New Haven: Yale University Press.
Orlikowski, Wanda J. (1992): "Learning form Notes: Organizational Issues in Groupware Implementation." Sloan WP No. 3428-92.
Savage (1995): 5th Generation Management.
van Alstyne, Marshall (1996): "The State of the Network Organization: A Survey in Three Frameworks." Sloan School, mimeo.
Wenger (1997a): "Information Technology and Costly Communication." mimeo.
Wenger, Albert (1997b): "Information Technology and Firm Size." mimeo.
Womack, James P., Daniel T. Jones, and Daniel Roos (1990): The Machine That Changed The World. New York: Rawson Associates.
Zuboff, Shoshana (1985): "Technologies That Informate: Implications for Human Resource Management in the Computerized Industrial Workplace." In HRM: Trends and Challenges, R. E. Walton and P. R. Lawrence, Ed., Boston, MA: Harvard Business School Press.