Information Technology and Firm Size

1.INTRODUCTION

Information Technology (IT) has been compared to electricity in its potential to affect the organization of economic activity (David 1989). Electricity was crucial to the formation of the modern enterprise, both in its ability to power machines on the shop floor and in its use for communication (Chandler 1977). Malone, Yates and Benjamin (1987) and others have argued that IT can have a similarly profound effect by reducing the costs of coordination both within and between firms. The diffusion of electricity and the rise of the modern enterprise took place over an extended period spanning half a century (David 1989). IT has now been used in business for about three decades, with an exponentially growing diffusion (Brynjolfsson 1996). Has IT already begun to result in a measurable reorganization of economic activity? Changes in the size of firms are among the most visible signs of such a re-organization. The purpose of this exploratory paper is therefore to examine whether there is evidence that IT has affected the size of firms.

Anecdotal evidence suggests that significant changes in firm size are taking place throughout the economy. There appear to be two opposing trends. On the one hand, there are the related phenomena of downsizing, outsourcing, and spin-offs which all result in smaller firms. For instance, AT&T shed more than 10,000 employees and spun off its equipment manufacturing branch.1 Similarly, the big three automotive companies have been selling off their parts divisions. On the other hand, strong merger and consolidation trends are resulting in larger firms in many industries.2 For instance, the financial services industry is being transformed by a wave of both horizontal mergers (e.g. between Nationsbank and BankAmerica) and mergers between firms offering complementary services (e.g. Citibank's merger with Travelers). Similar high profile mergers are taking place in the entertainment and communication industries (e.g. ABC and Disney, MCI and WorldCom).

There are plausible explanations linking IT to both of these trends. For instance, to the extent that IT improves productivity (Brynjolfsson and Hitt 1996), it may contribute to the downsizing layoffs. Outsourcing or spinning off activities such as logistics, which require tight operational links, may also be facilitated by IT (Eaton 1997). At the same time, IT tremendously improves the ability to share and combine databases (e.g. customer profiles), thus creating new strategic opportunities (e.g. for cross-selling). Such pooling of information appears to be part of the motivation behind many of the recent mergers (Siconolfi and Raghavan 1997).

1 One of the largest IPOs ever, the spin-off is now called Lucent Technologies and has outperformed the stock-market.
2 The total value of mergers and acquisitions in the United States has increased almost tenfold from $120 billion in 1991 to $920 billion in 1997 (Securities Data Corporation).

Given these conflicting possibilities and given the selection biases of anecdotal evidence, this paper focuses on comprehensive but high-level empirical evidence on changes in firm size. If IT really is similar to electricity, there should be large-scale trends that affect many industries and can be discerned by looking a:ross industries. In fact, studying a single industry in great detail will not provide much information about whether an overall pattern of change exists. This exploratory paper therefore follows the lead taken by Brynjolfsson, Malone, Gurbaxani and Kambil (BMGK 1994). They found evidence that IT investments are associated with decreases in firm size in manufacturing. Their work is expanded here in a number of important ways. First, data for a larger time period including more recent data is analyzed. Second, data is analyzed at the industry rather than sector level. Third, human capital data is introduced as an additional explanatory factor for firm size.

The remainder of the paper is structured as follows. Section 2 provides additional background and motivation. Section 3 presents a framework for analyzing the influence of IT on firm size. Section 4 explains the data sources and the empirical approach. Section 5 presents various trends in the data including the results of some exploratory regression analyses. Section 6 discusses these trends and results, Section 7 offers conclusions and suggestions for further work.

2. FIRM SIZE MATTERS

Since Coase's seminal 1937 paper (Coase 1937), one of the major discussions in economics has centered around the question why some activities are carried out within firms, while others are carried out in markets (i.e. between firms). A large variety of different theories have been proposed3 and new ones are still emerging.4 Empirical studies of firm size can contribute to this discussion by identifying factors that appear to influence where activities are carried out. Most existing studies have focused on particular industries5 or even individual case studies6 in order to be able to isolate factors influencing firm size. The approach taken here and in BMGK instead looks for large scale trends across many industries as a result of changes in IT. There are two reasons why this approach is appealing.

First, IT provides essentially a "natural experiment." Over the past decades the price of IT has continuously declined, while at the same time IT performance has improved. In combination, this has resulted in an unprecedented improvement in the performance-adjusted price, which has declined an average of 20% per year every year since the 1960s (Gordon 1990). The price decline has been driven mostly by technological improvements. For instance, transistor density on computer chips has doubled roughly every 18 months. This trend, known as "Moore's Law" after Gordon Moore (one of the co-founders of Intel), has held since the 1960s and is expected to continue well into the next century. The increased availability of IT can therefore be considered to be exogenous to organizational form.

Second, IT can be expected to have a broad influence on firm size. Compared to many other technologies that are industry-specific, IT is a general-purpose technology that can be applied across all industries. Furthermore, IT not only affects what is traditionally thought of as production technology (i.e. machines) but also changes the available "organizational" technology. This argument was first made by Malone, Yates, and Benjamin (1987). They argued that IT reduces what they termed "coordination costs" and that such a decrease should favor markets and thus result in smaller firms. BMGK draws on this argument as the main theoretical justification for expecting IT to be associated with a decrease in firm size. Section 3 develops a more detailed view of the relation between IT and firm size by drawing on the role of assets in determining firm boundaries.

3 For example Coase (1937), Williamson (1973).
4 For example Baker, Gibbons et al. (1995), Holmstrtfm (1997).
5 For example Joskow (1985).
6 For example Alchian and Demsetz (1972).

3. LINKING IT TO FIRM SIZE

3.1 Effect of IT on Assets Establishes Link to Firm Size

Before looking at data, even in an exploratory analysis like the one in this paper, it is useful to set up expectations based on theory. While no formal hypothesis tests will be conducted, the expectations provide a useful baseline with which the findings can be compared and contrasted. Firm size will be measured throughout this paper as the number of employees per firm.7 This measure is far from perfect, since it is subject to the definition of who is an employee. Considering the recent issue of "perma-temps," i.e. human assets who are formally employees of one firm (e.g. a temp agency) but de facto work for another firm over a long period of time. Nevertheless, for an economy-wide analysis, the number of employees per firm is the most viable measure of firm size. Market value would be the most desirable alternative, since it measures the total value of the assets controlled by a firm. Unfortunately, this measure is only available for publicly traded firms which would introduce a bias towards larger firms. The book value of physical assets is not an appropriate measure, since it bears little relationship to the economic value of the assets and ignores information assets entirely. Finally, sales data makes the type of comparisons between industries and sectors difficult, which are the explicit goal of the exploratory analyses in this paper.

Given the use of employees per firm as the measure of firm size, there are at least five ways in which IT may influence firm size. This list is clearly not exhaustive, but is meant to show key mechanisms that have been discussed in the literature.8

  • Substitution: IT may change the number of employees required for achieving a given output with a given set of physical and information assets. For instance, due to automation a new machine using IT may require only one operator whereas the old machine required two operators.
  • Human Asset Relation: IT may contribute to an increase in human capital, which in turn may result in a change from employment to independent contracting. For example, the human assets required to program computers are often highly skilled and frequently work as consultants moving from firm to firm, rather than being employed by any one firm.
  • Physical Asset Distribution: IT may increase the distribution of physical assets across firms. For instance, a milling tool that used to be specific to one purpose may be become flexible through IT, thus facilitating its ownership by an independent supplier. This change will increase the size of the supplier and decrease the size of the buyer to the extent that the employees operating the milling tool move along with the asset.
  • Information Asset Concentration: IT may also change the distribution of information assets across firms. For example, customer databases from two firms may be combined in order to extract greater value from the combined information. This combination of information assets will increase firm size, if extracting the additional value requires the merger of the two firms.
  • Reduced Coordination Cost: IT may facilitate the coordination of activities across firms. For instance, through Electronic Data Interchange (EDI) activities may be coordinated between a buyer and a supplier that would previously have required geographical co-location in order for sufficient information to be available. As was first argued by Malone, Yates, and Benjamin (1987), reduced coordination cost may thus result in smaller firms.

These five different paths of influence will now be examined in greater detail.

7 Using the number of employees per firm is most compatible with the interpretation of the firm as a "sub-economy," which has the purpose of creating and maintaining a specific system of incentives for its employees (Holmstrom 1997).
8 For instance, Brynjclfsson (1994) provides elegant formal explanations for several of these mechanisms based on the Hart and Moore (1990) property rights approach.

3.2 Substitution

IT may be used to substitute physical assets for human assets. Holding everything else constant, such an "automation" effect would tend to reduce firm size as measured by the number of employees per firm. For instance, the automation of switches in the telecommunication industry has resulted in a significant reduction in the number of employees at traditional carriers, such as AT&T. The positive impact of IT on productivity has been statistically demonstrated (Brynjolfsson and Hitt 1993), especially for manufacturing industries. It appears that there is a clear substitution of improved and more productive physical assets (which generally embed significant amounts of IT) for unskilled labor. Industries, which invest significantly in new physical assets, may therefore experience a decrease in firm size as measured by employees per firm.9

The case is less clear for information assets. Certainly anecdotal evidence can be found for both a substitution for human assets and for a complementarity with human assets. For instance, a bank that invests in collecting more detailed information about its customers may hire additional analysts for evaluating the information (e.g. in order to increase the profitability of its products). There is some statistical evidence (Berndt, Morrison et al. 1994; Autor, Katz et al. 1997) which suggests that there may be a fairly broad complementarity between information assets and skilled human assets. Industries, which invest heavily in information assets, may therefore show an increase in firm size as measured by employees per firm.

9 This and the following arguments are all ceteris paribus, i.e., holding everything else constant. For instance, if the output per firm rises substantially, the output increase may more than offset the reduction in the number of employees from substitution with a net result of an increase in the employees per firm.

3.3 Human Asset Relation

Unlike physical or information assets, human assets cannot legally be "owned" Traditionally, however, ownership cf physical assets provided a significant degree of control over human assets. Unskilled employees required access to physical assets in order to be productive and one unskilled employee could easily be substituted for another. The employment relationship can then be interpreted as the outcome of bargaining where almost all the bargaining power rests with the firms as owners of the physical assets. Since production was generally labor intensive, firms that owned many physical assets tended to also have a large number of employees.

IT may shift this balance of power in favor of the human assets. IT replaces physical interaction with machines with "symbolic" interaction and thus requires abstract analytical skills (Zuboff 1985). This shift from "brawn" to "brain" has been well documented for several industries, including traditional manufacturing businesses (Womack, Jones et al. 1990). During this transition, highly skilled human assets are likely to be in short supply10 and as a result will have a strong bargaining position vis-&-vis firms as the owners of physical and information assets. Therefore the outcome will be more frequently that the human assets work as independent contractors instead of as employees.11

10 Changes in the skill base are generally slow, as new skills are acquired mostly by new generations of employees. This partially explains the high demand in the US for HID visas, which permit qualified foreign nationals to be employed in high-tech jobs for which there is a shortage of skilled US citizens.
11 In fact, many of the middle managers who were laid off during corporate downsizing in the early 1990s were rehired (sometimes immediately) as outside consultants.

The tremendous growth of consulting firms and similar firms that provide highly skilled human assets is consistent with this shift from employment to contracting.12 Individuals working for such firms also have stronger incentives to invest in furthering their human capital, because they will be able to realize higher returns to those skills. Industries in which highly skilled human assets have become more important as a result of IT should therefore show a decrease in firm size as measured by employees per firm.13

3.4 Physical Asset Distribution

Ownership of a physical asset provides an incentive to maintain or even increase the asset's market value and to invest in effort and human capital that are complementary with the asset (i.e. more valuable when used in conjunction with the asset).14 For instance, the owner of a stamping machine for metal parts will invest in the skill for operating the machine, will maintain the machine, will make investments that reduce the cost of stamping for all parts, and will expend effort on creating innovative products.

At the same time, however, ownership may prevent investments that increase the value of the physical asset for a specific purpose. The owner of the stamping machine may not want to invest in producing a specialized part for a particular customer. The owner will be worried that the investment can not be adequately recovered due to later bargaining with the customer (e.g. the customer changes the part or finds a different supplier). Frequently this underinvestment problem cannot be solved through contracts because of unanticipated contingencies. Hence the customer has to acquire the asset.

12 This trend towards outside consultants has frequently been attributed to firms economizing on benefits (e.g. health insurance). While this may be a partial explanation, it is likely to be less important as many of the outside consultants without benefits are by far more expensive for the firm than an employee with benefits.
13 Skilled human assets may of course have become more important for other reasons as well, such as the increased globalization of markets.
14 This point is well illustrated by the differences in behavior between renters and owners of real estate, cars, etc.

IT has the effect of making many physical assets more flexible by making them programmable. Put differently, IT reduces the investment needed for producing a specific output. For instance, most modern manufacturing equipment is programmable and can be rapidly adjusted in order to produce a variant or even an entirely different output. This reduces the need for ownership to overcome the under-investment problem. Separate ownership therefore becomes possible in cases where stronger incentives for equipment maintenance or product innovation are required.

Consider, for example, the automotive industry. Over the past decade automotive companies around the world have significantly reduced their degree of vertical integration at the same time that they have increased the variety and frequency of change in their car models. These changes are at least partially a result of the increased flexibility of manufacturing equipment combined with an increased need for product innovation (Womack, Jones et al. 1990). The increased distribution of physical assets across multiple firms brings with it an increased distribution of the necessary human assets and hence a decrease in firm size as measured by employees per firm. The resulting decrease in firms size should be strongest in industries where physical assets are important and are now made more flexible through IT.15

3.5 Information Asset Concentration

In addition to physical and human assets, there are also "information assets" such as customer information stored in a database (Brynjolfsson 1994). Information assets are different from physical assets since they can be copied at very low cost (essentially zero) and their use is non-exclusive. They are also different from human assets since they can legally be owned by a firm.

IT makes investments in information assets more important. First, IT facilitates the collection of the necessary inputs. For instance, in retailing, scanner data is collected automatically as part of the check-out process. Second, IT provides storage and processing capacity to help with data analysis. Finally, once new information assets have been created, IT facilitates their rapid communication and sharing. IT thus increases the value of information assets tremendously. Firms such as Wal-Mart aggressively gather many terabytes of scanner data from locations nationwide and analyze them to identify subtle patterns of consumer demand. By sharing these analyses across stores and using them for centralized purchasing decisions, Wal-Mart stores can gain an advantage over stand-alone stores.

15 Note that much of the IT in question here is embedded in the physical capital in the form of electronic controllers (as opposed to separate computers).

The improvements in IT can therefore increase firms' "informational economies of scale" (Wilson 1975). These scale economies may be difficult to exploit across firm boundaries. For instance, it would be difficult for a large number of small banks to pool all their information and then act jointly upon it. The banks cannot anticipate what the results of analyzing the joint information will be. For instance, it may be optimal to close some of the bank branches completely and change the product mix and pricing at others. Given that it is impossible to properly anticipate how the benefits should be distributed among the banks for each of the possibly optimal actions, the banks will have little incentive to contribute to the information pool and its evaluation.16 This underinvestment can be overcome by combining all the banks into a larger firm, which combines the information assets and retains all the benefits from pooling and analyzing them.17 As the necessary human assets move with the information assets, firm size as measured by employees per firm increases, The resulting increase in firm size should be strongest in industries where information assets are important.

3.6 Reduced Coordination Cost

In their seminal article Malone, Yates, and Benjamin (1987) argued that by reducing coordination costs, IT will favor market transactions and hence smaller firms. They distinguished between production and coordination cost and asserted that for market transactions ("buy"), coordination cost account for a higher fraction of total cost, when compared to transactions within a firm ("make"). Hence, a reduction in coordination cost will render "buying" more attractive than "making." This argument suggests that the increased use of IT should be associated with a trend towards smaller firms.18

The Malone, Yates, and Benjamin (1987) account can be reconciled with the more recent theories of the firms in a number of ways. First, as shown formally in Wenger (1998), the ability to communicate more information expands the opportunities for coordination and may make increased incentives desireable, which can be provided better by smaller firms. Second, to the extent that IT can be used to obtain better performance measures, it may be possible to buy services and products that previously had to be made internally due to contractual incompleteness. For instance, many manufacturers now have so-called "Supply Chain Management" systems that link them electronically with their suppliers. These systems not only permit a much increased exchange of information, but also collect detailed performance statistics about on-time delivery and parts quality for each supplier.

16 This is a stronger version of the "paradox" that the value of information cannot be assessed until the information has been (mostly) disclosed, at which point there is no incentive left to pay for the information (Arrow 1973), While laws such as patent protection reduce the inefficiencies around the disclosure of existing information, they do not help with the problem of combining information to generate new information.
17 The combination of information assets may not always require a merger. For Instance, firms may be able to share customer information for cross marketing purposes (for interesting anecdotal evidence see Konsynski and McFarlan 1990).
18 This argument was the principal theoretical justification in BMGK 1994.

3.7 Trade and Other Forces

One other force that has frequently been argued to have a broad cross-industry effect on firm size is trade liberalization. Trade liberalization expands the size of markets. If domestic firms increase their sales as a result of exports, trade liberalization may lead to an increase in firm size. On the other hand, there will be more competition due to imports and domestic firms are given the possibility of moving production to countries with lower labor cost. Both of these influences might cause a decrease in firm size when measured as the number of domestic employees. The large US trade deficit suggests that the two latter effects may be more powerful than the effect of larger markets. For the manufacturing sector, where trade is substantially more important than in the retail and service sectors,19 it will be included explicitly in the regression analyses.

Many other forces certainly also affect the size of firms. These forces are largely ignored here, since they are assumed to be idiosyncratic to individual firms or at most individual industries within each of the sectors. In the exploratory regressions, various techniques such as dummy variables and fixed effects estimation are used to reduce the influence of omitting these factors on the results.

19 Trade obviously plays a minor role in retailing. In the service sector, trade has become important only for the financial and insurance industries, which are not considered here.

3.8 The Combined Effect

IT can thus be expected to influence firm size in a number of direct and indirect and potentially countervailing ways. Table 1 summarizes the expected effects separately for the manufacturing sector on the one hand and the retail and services sectors on the other.

Table 1: Summary of IT Influence on Firm Size20

Effect

Manufacturing

Retail / Services

Substitution

Smaller: Substitution of more productive physical assets for labor

Larger: Complementarity btw. labor and increased information assets

Human Asset Relation

Smaller: Switch from employment to outside contracting

Smaller: Switch from employment to outside contracting

Physical Asset Distribution

Smaller: Increased flexibility of physical assets and better monitoring

Less important

Information Asset Cone.

Less important

Larger: Merging of firms to exploit information economies of scale

Reduced
Coordination
Cost

Smaller: Switch from "make" to "buy"

Smaller: Switch from "make" to "buy"

Trade

Smaller: Increased imports and production abroad

Less important

COMBINED

Smaller

Indeterminate

The differences between the two arise because traditionally physical assets played a much larger role in manufacturing, while information assets are likely to have been more important in retail and services since the latter do not have many physical assets to begin with. These effects show that one should expect differences between manufacturing on the one hand and retail and services on the other. The remainder of the paper analyzes empirical evidence to examine these differences.

20 All analyses are conducted separately for each of the three sectors. Therefore, the relative importance of influences within a sector matters, e.g. whether the concentration of information assets is expected to have a strong influence compared to physical asset distribution in retail.

Data Sources and Empirical Approach

4.1 Firm Size

The data sources for firm size are the Census of Manufactures, the Census of Retail Trade, and the Census of Selected Services.21 For the census years22 these reports list the total number of employees and the total number of firms by industry so that an average firm size can be calculated as employees per firm. An additional measure from the same source is the number of establishments per firm where an establishment is a location at which business is conducted. For instance, in a retail firm, each shop is a separate establishment. An interesting feature of the Census data is that it provides separate statistics for firms operating only one establishment (single establishment firms) and those operating many (multi-establishment firms). Considerable data cleaning work was performed in order to account for changes in SIC codes and in Census coverage (see Appendix Al for details on the construction procedures for the firm size measures).

4.2 Physical Assets

The influence of physical assets was assumed to take two forms: substitution for unskilled human capital due to higher asset productivity and increased distribution across firms due higher asset flexibility. Both asset productivity and flexibility are difficult to measure directly and there is no information on how much IT is embedded in the physical assets. Instead, it will be assumed that newer physical assets are more productive and more flexible because they are likely to have more embedded IT. Various measures of the change in total physical assets are considered as proxies for the age of the physical assets. Presumably, industries with a growth in physical assets are adding more productive and more flexible new physical assets faster than other industries. In order to adjust for differences in the output growth across industries, physical asset intensities are used in the analyses.23 The data source is the Bureau of Economic Analysis (BEA) report on Fixed Reproducible Wealth. Since these tables exist only at the two digit SIC level, they were combined with Census information for distributing the capital across the three digit SIC level for retail and services (more detail on the construction procedures can be found in Appendix A2).

21 These are a wide variety of services ranging from advertising to shoe repair, hut excluding all transportation services and all financial, insurance, and real estate services.
22 The census years are 1967,1972,1977,1982,1987, and 1992. Due to budget cuts at the Census Bureau, 1997 data may never become publicly available. Even in the past, the firm size statistics were published last and usually were not available until several years after the Census.
23 An intensity is a measure of assets used for every unit of a different input or output, e.g. the physical assets per dollar of output or per employee.

4.3 Information Assets

Information assets cannot be measured directly. As was argued above, the ability to create and exploit information capital has been enhanced tremendously through the use of IT. Therefore investments in IT will be used as a proxy for changes in the importance of information assets. The choice of IT investment as a proxy for information assets introduces a potential bias to the extent that this investment also contributes to the increased productivity and flexibility of physical assets. The data source is again the Bureau of Economic Analysis (BEA) reports on Fixed Reproducible Wealth. Since these tables exist only at the two digit SIC level, they were combined with Census information for distributing the IT investments across the three digit SIC level for retail and services (more detail on the construction procedures can be found in Appendix A2).

4.4 Human Assets

The skill level of human assets is again difficult to measure directly. It was assumed that schooling is a good proxy for skills. This is based both on empirical evidence and on the intuition that individuals with more education will continue to make and receive higher investments in their training. The data source is the Current Population Survey (CPS). The CPS contains information for individuals about their level of schooling and the industry in which they work. The human capital variables were constructed by determining the percentage of individuals employed in an industry that have obtained a particular level of schooling (more detail on the construction procedures can be found in Appendix A3).

4.5 Trade Data

For manufacturing industries the importance of imports and exports is used to capture the effect from changes in trade liberalization. The import and export shares are calculated as the fraction of total domestic shipments in an industry. The data source is the NBER trade database.

4.6 Empirical Approach

Since the purpose of this paper is to show overall trends in firm size and explore their relationship to IT rather than to test precise hypotheses about the effects of IT for a specific industry segment, the empirical approach is predominantly descriptive. First, trends in firm size are shown for different sectors and different types of firms. Then, simple correlations of these trends in firm size with trends in the various assets are considered. Finally, the results from a few exploratory regressions are reported.

5. DATA DESCRIPTION AND EXPLORATION

5.1 Trends in Firm Size

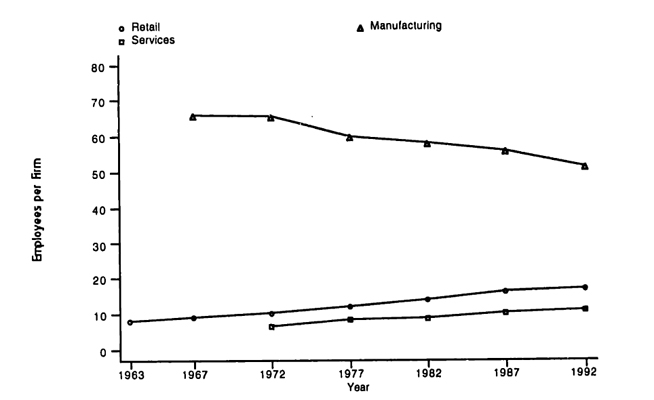
In order to show the trends in firm size for different industries, a number of graphs were constructed. The difference between manufacturing on the one hand and retail and services on the other is quite pronounced. As Figure 2 shows, firm size is clearly declining in manufacturing while it is growing in retail and services.24

One possible explanation for the changes at this high level of aggregation might be shifts in the relative importance of industries within a sector. For instance, it could be the case that manufacturing firms are actually growing within each industry, but firms are increasingly in industries with low firm size. To rule this out, simple time trends were calculated by industry and tabulated. Table 2 demonstrates that the majority of the changes in firm size is attributable to changes within industries rather than shifts in the distribution of firms across industries.

24 Since the transportation, utilities, and FIRE (finance, insurance, real estate) sectors are not included in the data, no average trend for the economy as a whole can be provided.

Table 2: Firm Size Time Trends

Sector - (90%)25 - (ns)26 + (ns) + (90%) P = 0.527
Manufacturing 13 3 3 1 0.0059
Retail 0 0 1 18 0.0000
Service 2 6 8 25 0.0001

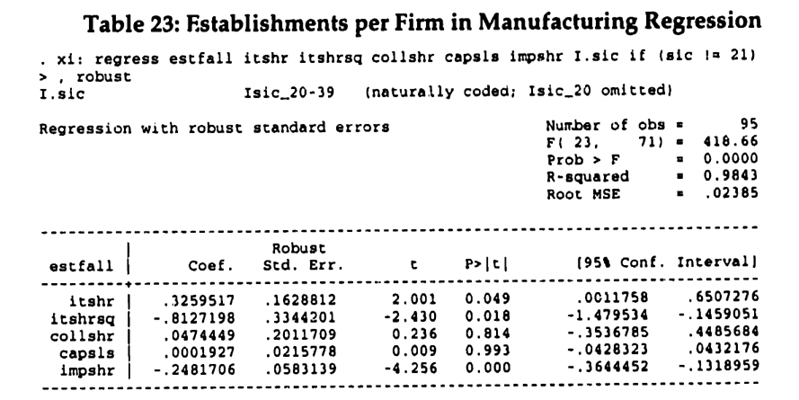
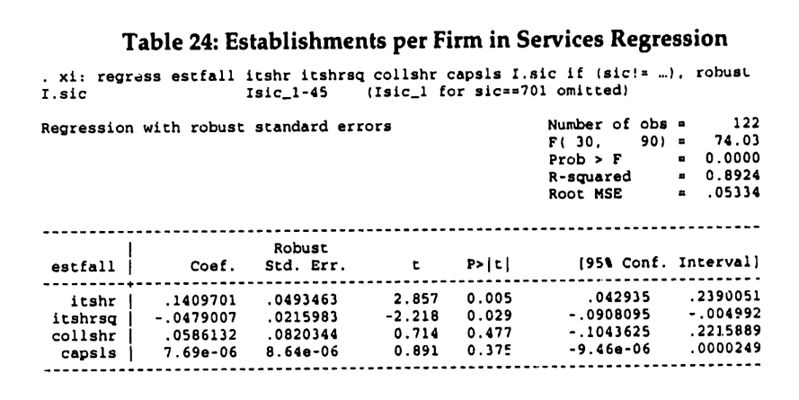
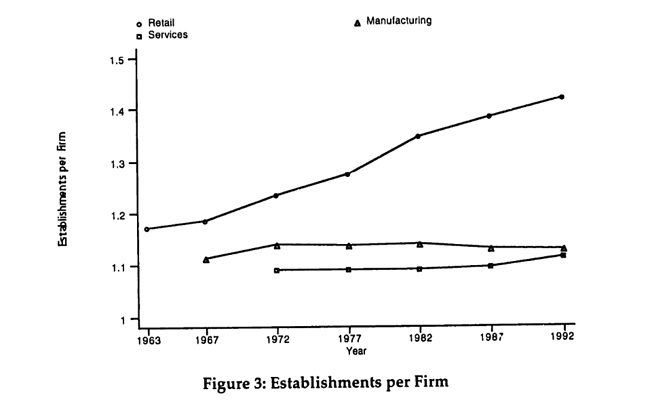
The changes in firm size can be broken down into changes in the number of establishments per firm and the number of employees per establishment.28 As can be seen in Figure 3, the establishments per firm have been increasing for retail since the 1960s and for services since the 1980s while they have been flat for manufacturing and even declining in the 1980s.

25 This column shows the number of industries within a sector, which have a negative time trend in firm size, i.e. for which firm size is decreasing over time, at a 90% significance level.
26 Same as the previous column, except that the trend is not statistically significant.
27 This is a simple non-parametric test, which indicates the probability that the observed pattern of positive and negative trends is the outcome of chance, Put differently, if the trend were equally likely to be positive or negative for any industry, how likely would the observed distribution be for this sector. The test is based solely on the number of positive and negative trends and does not take the significance into account.
28 An establishment is defined as a location at which the firm conducts business. For instance, for a retail chain each store is counted as a separate establishment. In manufacturing, an establishment corresponds roughly to a plant.

Again, by tabulating the time trends per industry this is seen to be mostly a "within" effect as shown in Table 3.

Table 3: Establishments per Firm Time Trends

Sector - (90%) - (ns) + (ns) + (90%) P = 0.5
Manufacturing 8 6 3 3 0.0577
Retail 1 3 2 13 0.0096
Service 4 8 10 19 0.0058


The number of employees per establishment has also changed, as shown in Figure 4

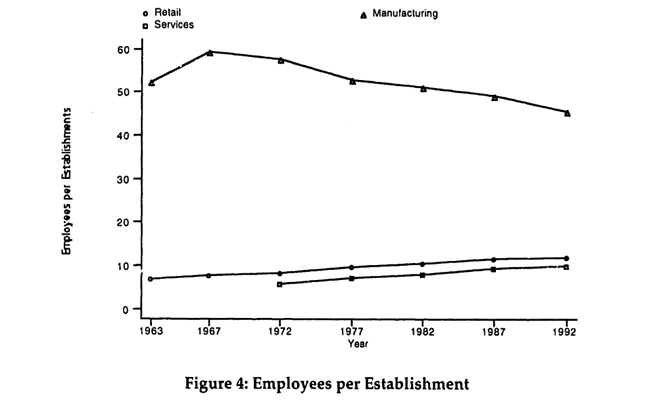
The number of employees per establishment has been decreasing significantly in manufacturing while it has been increasing in both the retail and service sectors. The tabulation of time trends shown in Table 4.

Table 4: Employees per Establishment

Sector - (90%) - (ns) + (ns) + (90%) P = 0.5
Manufacturing 12 5 2 1 0.0013
Retail 0 0 2 17 0.0000
Service 2 4 13 22 0.0000

The changes are summarized in Table 5, which shows the change in the composition of firm size between 1972 and 1992 for the three sectors.

Table 5: Firm Size Decomposition for All Firms

Sector (Year) Establ. / Firm Empl. / Establ. Empl. / Firm
Manufacturing 1972 1.14 D7.68 65.75
Manufacturing 1992 1.13 45.69 51.63
Retail 1972 1.23 8.49 10.44
Retail 1992 1.43 12.06 17.25
Services 1972 1.09 5.98 6.51
Services 1992 1.11 10.03 11.13

From Table 5 it would appear that in both the manufacturing and service sectors, the number of establishments per firm has been quite stable over time and that changes in firm size have been driven mostly by changes in the number of employees per establishment. This, however, obscures important changes in the relation between so-called single and multi-establishment firms. A multi-establishment firm is one that operates multiple establishments in the same industry.


Table 6: Share of Multi-Establishment Firms

Sector (Year) Establishments Employees Firms
Manufacturing 1972 19.8% 73.6% 8.7%
Manufacturing 1992 18.9% 69.7% 8.6%
Retail 1972 22.3% 47.3% 41.5%
Retail 1992 33.0% 57.8% 48.3%
Services 1972 10.9% 32.8% 2.7%
Services 1992 12.8% 37.7% 2.8%

As Table 6 illustrates, multi-establishment firms have become more important in both the retail and service sectors while they have declined slightly in importance in manufacturing. Examining the breakdown into establishments per firm and employees per establishment for multi-establishment firms as shown in Table 7 further highlights the significant differences between the manufacturing sector on the one hand and the retail and service sectors on the other.

Table 7: Firm Size Decomposition for Multi-Establishment Firms

Sector (Year) Establ. / Firm Empl. / Establ. Empl. / Firm
Manufacturing 1972 2.61 213.48 557.18
Manufacturing 1992 2.49 168.35 419.19
Retail 1972 6.73 18.01 121.21
Retail 1992 9.70 21.14 205.06
Services 1972 4.35 17.99 78.26
Services 1992 5.05 29.53 149.13

In summary, manufacturing is experiencing a decline in firm size, mostly due to a decrease in the number of employees per establishment. In the retail and service sectors, firm size is increasing not only due to an increase in the number of employees per establishment but also especially for multi-establishment firms due to an increase in the number of establishments per firm. These findings are consistent with the theorized ways in which IT may affect firm size, In particular, the decrease in employees per establishment in manufacturing is consistent with the distribution of physical assets across firms and the substitution of physical assets for human assets. Similarly, the increase in establishments per firm in retail and services is consistent with a concentration of information assets and the increase in employees per establishment is consistent with a complementarity between information assets and human assets.

An important caveat is that all of these graphs and tables consider US establishments and employment only. It is therefore quite conceivable and even plausible that manufacturing firms have experienced more international growth than retail and service firms. This explanation is an important alternative that unfortunately cannot be examined using the currently available information. It does not, however, change the fact that the number of employees per manufacturing establishment has clearly been decreasing.

5.2 Trends in Physical Assets

Various measures of physical asset intensity are conceivable. The one most pertinent to the issue at hand is the physical assets per firm, The trends in gross physical assets per firm (equipment plus structures) in current prices are shown in Figure 5 using a logarithmic scale.

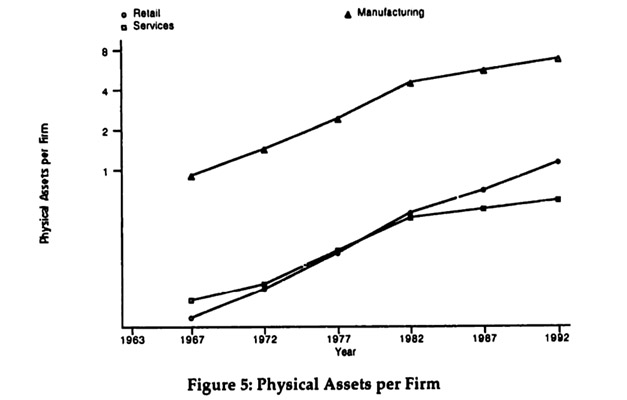
Figure 5 confirms the expectation that manufacturing firms tend to bring together significantly more physical assets per firm than retail and service firms do. The growth in physical assets per firm has slowed down in all three sectors since 1982, but especially so in the services and manufacturing sectors. This slow¬down is consistent with the notion that information assets are becoming more important relative to physical assets.

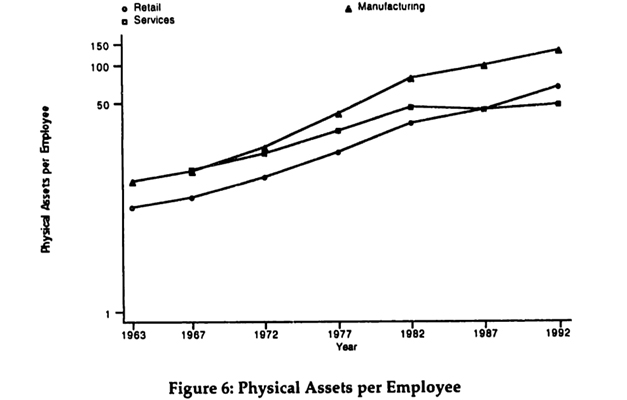
The picture hardly changes when capital per employee is considered as shown in Figure 6. This measure confirms that there has been a slow-down in the growth of physical assets. Surprisingly, Figure 6 shows that in the 1960s there was little difference between the retail, service, and manufacturing sectors. The widening gap over time, especially between the manufacturing and service sectors, is evidence consistent with an increased importance of information assets as a factor of production in the service sector.

For the manufacturing sector, the Census data also contains a breakdown of investment in physical assets between single and multi-establishment firms. The fraction of investment by multi-establishment firms peaked in 1982 at 88% and declined to 85% by 1992. This trend reversal is especially pronounced in the product manufacturing industries when compared to process industries as can be seen in Table 8.29

Table 8: Share of Investment in Physical Assets by Multi-Establishment Firms

Product Mfct. Industries 1963 1967 1972 1977 1982 1987 1992
Textile Products 77% 80% 80% 83% 88% 86% 82%
Fabricated Metal 65% 71% 71% 71% 73% 76% 67%
Industrial Machinery 70% 75% 77% 80% 81% 77% 76%
Transport Equipment 87% 94% 95% 96% 96% 86% 88%
29 These time series are shown as a table so that all graphs in the paper show comparisons of the three sectors.

The reversal of the trend in the share of multi-establishment firms is consistent with the idea that physical assets are becoming more flexible, due to embedded IT.30 The more flexible assets are then distributed across more firms and especially smaller firms with only a single establishment. The trend reversal is also consistent with the reduced coordination cost argument.

30 The trend reversal is statistically significant. In a pooled regression of the share of investment in physical assets by multi-establishment firms on time and time squared, the coefficient for time is positive (significance 0.011), whereas the coefficient for time squared is negative (significance 0.048).

5.3 Trends in Human Assets

Direct measures of the skill of human assets are difficult to obtain. The best available measure is the degree of schooling of the work force in a particular industry. Schooling contributes directly to skills and also serves as an indicator for whether or not employees are likely to receive on-the-job training.31 Figure 7 shows the trends in the percentage of college graduates for the three sectors.32

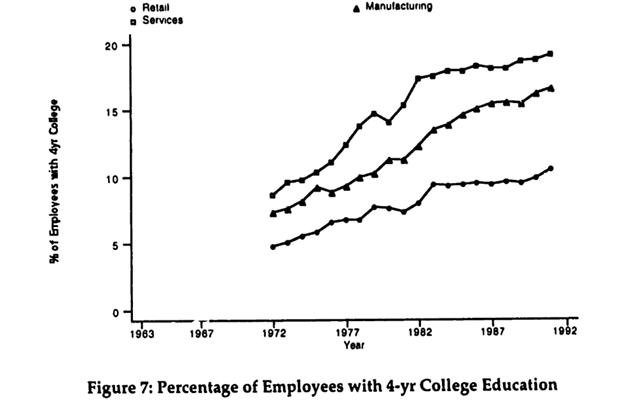
As Figure 7 shows there has been a significant increase in the share of college educated employees across all three sectors, which likely reflects general improvements in education. There are, however, differences between the sectors, which are summarized in Table 9. After strong increases throughout the 1970s, there was a marked slowdown in both the service and retail sectors in the growth of the percentage of college graduates. As a result, the gap between services and manufacturing has narrowed while the gap between manufacturing and retail has widened.

31 This indicator function of schooling results from the logic of screening and signaling models.
32
The service sector does not include healthcare and education, for which data is only available starting with the 1982 Census, but it does include legal professionals.

Table 9: Annual Increase in Percentage of College Educated Employees

Sector 1973 - 1982 1983 - 1992
Manufacturing 0.4% 0.3%
Retail 0.3% 0.1%
Service 0.7% 0.2%

The graph and table look similar when the percentage of employees with at least some graduate education is considered. If the argument about changes in the employment relationship to outside contracting holds, the effect should be strongest in manufacturing (especially after 1982).

5.4 Trends in Information Assets

As discussed above, investment in IT will serve as a proxy for the importance of information assets. Several categories of the investments published by the BEA could be interpreted as IT. The two included here are OCAM (Office Equipment, Computers, Accounting Machinery) and Communications Equipment. The net IT capital stock per firm is graphed in Figure 8 using a logarithmic scale.33

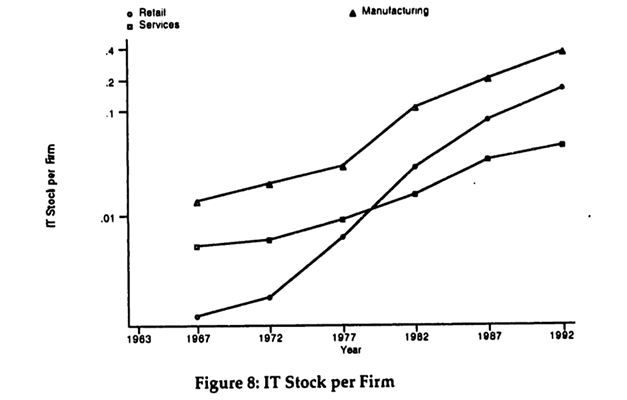
Figure 8 shows that IT stock has been built up at an exponential rate. The even faster growth after 1977 is due to the deployment of personal computers and rapidly growing investments in communication equipment. Figure 9 also reveals that the retail sector has been the most aggressive in adopting IT.

In order to illustrate the relative importance of IT capital compared to other equipment. Figure 9 graphs the net IT stock as a percentage of total net equipment stock for each of the three sectors.

33 Net figures were used with a 15% annual deflator for IT stock. For details on the construction of the net data series see Appendix A2.

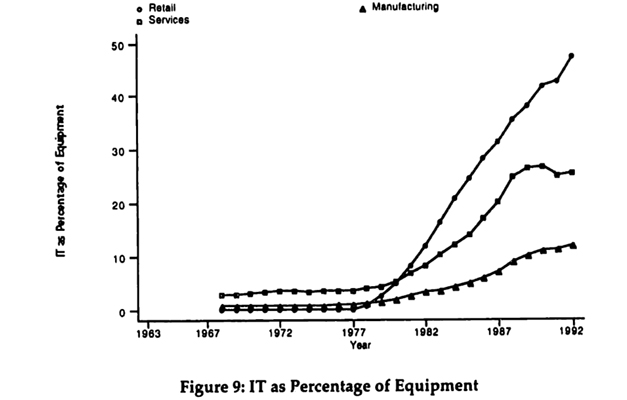
Figure 9 is consistent with the argument that information assets are likely to be of greater relevance compared to physical assets in the retail and service sectors than in the manufacturing sector. This interpretation is confirmed by considering the relation of book to market values for publicly traded firms in the three sectors in 1990, as shown in Table 10.34

Table 10: Book to Market Ratios

Sector Book Value Market Value Ratio Sample Size
Manufacturing 5,329 5,195 1.03 435
Retail 3,663 3,607 1.01 78
Service 2,438 3,005 0.81 27

The higher market values relative to book values especially for firms in the service sector35 are consistent with a more important role of intangible information assets in these sectors when compared to manufacturing.

34 1 am grateful to Shinkyu Yang for providing these figures from his analyses of the effects of IT usage on market valuation (see Brynjolfsson and Yang 1997 for details). 35 The book value of retail firms tends to be biased upward relative to manufacturing and service firms. Book values are based on historical cost and a large fraction of the assets of retail firms are inventory items for which historical cost is much closer to replacement cost than for equipment and structures.

5.5 Simple Correlations

In addition to the trends, it is useful to consider some simple correlations. As was argued above, the effect of physical assets should be the result of increased productivity and increased flexibility. Since direct measures are not available, changes in physical asset intensity will be used instead. First, consider the correlation between "differences" in physical asset intensity36 and firm size as shown in Table 11. The differences are the changes from one census year to the next, e.g. from 1972 to 1977.

Table 11: Diff. Correlations btw. Physical Asset Intensity and Firm Size37

Sector Coefficient Significance Observations38
Manufacturing -0.2549 0.012 95
Retail -0.1838 0.092 85
Service 0.0626 not significant 130

The results in Table 11, are consistent with the arguments that increased flexibility and productivity of physical assets due to embedded IT, as well as reduced coordination costs contribute to decreases in firm size as measured by the number of employees per firm. As expected, the effect is strongest in the manufacturing sector.

This finding is confirmed by considering correlations for levels of the same measures "within" each industry. Since only a few data points are available for each industry, the results are tallied and a non-parametric test is applied to determine the likelihood that the outcome was chance. The results are shown in Table 12.

36 Net equipment and net structures per dollar of sales.
37 There is a potential for simultaneity with respect to exogenous changes in output, since this might lower sales (and hence increase physical asset intensity) at the same time as the number of employees (and hence firm size), thus inducing negative correlation. The actual bias appears to be minimal, since the results are virtually identical when using total physical assets.
38 One or two industries were excluded in each sector, because they were outliers, which differed by more than three standard deviations from the other industries in the sector. These are the same industries which were later excluded in the exploratory regression analyses (see footnotes there for details).

Table 12: Within Correlations btw. Physical Asset Intensity and Firm Size

Sector Negative Positive P = 0.5
Manufacturing 16 3 0.0022
Retail 8 9 0.5000
Service 13 12 0.5000

Table 12 confirms that the effect of changes in physical assets is more important in the manufacturing sector than in the retail and services sectors.

It was argued above that increases in the skill level of human assets may result in a transition away from employment relationships and hence contribute to a decrease in firm size. The difference correlations between human assets, measured as the percentage of employees in an industry with a 4-year college education, and firm size are shown in Table 13.

Table 13: Diff, Correlations btw. Human Assets (4-yr) and Firm Size

Sector Coefficient Significance Observations
Manufacturing 0.0762 not significant 72
Retail -0.0050 not significant 68
Service -0.0572 not significant 102

Additional insight can be gained by considering the within correlations. The results are shown in Table 14.

Table 14: Within Correlations btw. Human Assets (4-yr) and Firm Size

Sector Negative Positive P = 0.5
Manufacturing 17 2 0.0004
Retail 0 18 0.0000
Service 5 20 0.0020

The coefficients have the expected negative sign only for manufacturing, whereas they are exclusively or predominantly positive for both retail and services.39 The results change somewhat when a stricter measure of human assets is applied, such as at least some graduate education. In that case 4 out of 18 coefficients turn out negative in retail and 10 out of 25 in services. On the whole, the correlation evidence for human assets does not fit well with the expectations and this contrast is explored further in the following sections.

Finally, consider information assets. It was argued that the increased use of IT makes information assets more important. Since information assets are complementary with human assets and tend to be concentrated, this should result in an increase in firm size as measured by the number of employees per firm. The difference correlations are shown in Table 15 and the within correlations in Table 16.

Table 15: Diff, Correlations btw. Information Assets40 and Firm Size

Sector Coefficient Significance Observations
Manufacturing 0.1898 0.065 95
Retail 0.1398 not significant 85
Service 0.0806 not significant 132

Table 16: Within Correlations btw. Information Assets and Firm Size

Sector Negative Positive P = 0.5
Manufacturing 16 3 0.0022
Retail 0 18 0.0000
Service 8 17 0.0539

The change between the difference and within correlations for manufacturing is surprising and warrants further attention. One possible explanation is that the within correlations are affected by "omitted" variables. In particular, in manufacturing the effects of both physical assets and human assets were seen above to be strongly negative for firm size. The information assets measure turns out to be significantly correlated with the human asset measure41 and may therefore pick up its effect. The next section attempts to sort out these conflicting results by considering the results of exploratory regression analyses, which determine the proper "partial" effects.

39 The reversal of signs relative to the difference correlations is not worrisome, since these are highly insignificant, i.e., the sign of the point estimates in Table 13 is not informative.
40 Information assets are measured as the share of net IT stock in the net total equipment stock.
41 The correlation coefficient is 0.5255 (95 observations, significance 0.0001).

5.6 Exploratory Regressions

The exploratory regressions were run on pooled data using industry dummy variables.42 This approach raises several econometric issues. First, since the size of the industries varies considerably, heteroskedasticity is a potential problem. Accordingly, robust standard errors are reported throughout.43 Second, serial correlation may be a problem in time series regressions. Given the five year intervals between census years, this is not likely to be a problem here, as was confirmed by Durbin-Watson statistics not significantly different from 2 (no serial correlation). Third, there are questions of simultaneity. Since these are exploratory regressions, no formal corrections—such as two stage least squares—were attempted. Instead, the independent variables were chosen to minimize the likelihood of simultaneity. In particular, instead of total investment levels for IT, the fraction of IT stock as a percentage of total equipment was used.

5.6.1 Exploratory Regression for Manufacturing

The manufacturing regression uses the number of employees per firm for all firms as the dependent variable (empfall) and the following independent variables:

-itshr: share of IT stock in total equipment (net stocks) to measure information assets relative to physical assets44
-collshr: share of employees who completed 4-yr college to measure the skill level of human assets
-capsls: physical asset intensity of sales
-impshr: share of imports in total market to measure the effects of trade in the industry

The results of this regression are shown in Table 17, with the industry dummy variables omitted. Note that one industry (SIC 21, Tobacco Products) was omitted because a residual plot revealed that it was an outlier.

42 Random effects regressions were also analyzed, While there generally were not enough data points to obtain robust results from the random effects regressions, they did confirm the sign of the coefficients.
43 Robust standard errors were calculated using the Huber-White estimator (Pindyck and Rubinfeld 1991).
44 An absolute measure of IT stock would be more likely to pick up a substitution effect from automation. The relative measure is meant to capture the importance of information assets. It also helps to reduce simultaneity effects between firm size and investment.

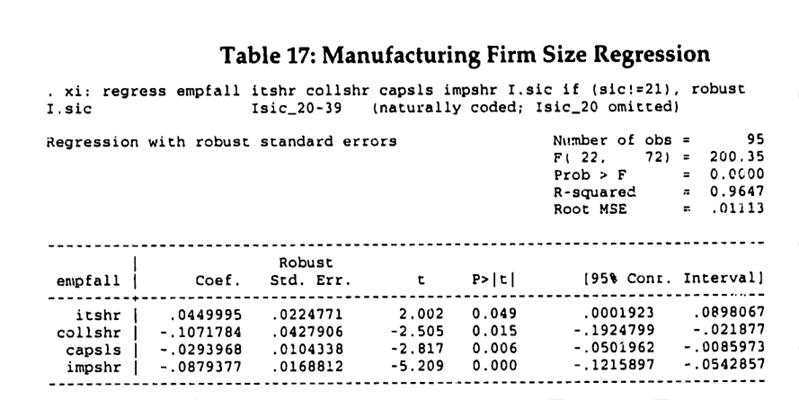
What is most surprising about the result is the contrast with the findings of BMGK, whose results suggested that the increased use of IT was associated with smaller firms. There are several important differences between the present regression and the BMGK analysis that help explain this contrast:45

  • The current regression contains an explicit measure of the effects of human assets, which were not directly accounted for in BMGK.
  • The measure of IT used here includes communication equipment, which was not included in BMGK.
  • BMGK employ absolute measures of IT and total equipment investment, whereas the independent variables here are relative measures (IT as a fraction of equipment and capital intensity of sales).
  • SIC 21 (Tobacco products) was included in the BMGK regressions, but excluded here since a residual plot showed it to be an outlier given the specification used here.46

The results of regressions with a specification closer to BMGK are shown in Table 18.

45 The firm size measures in BMGK were annual and taken from the County Business Patterns and Compustat, This data source difference is not included in the list above, because it should not affect the sign of coefficients.
46 In the pooled regressions the same model is applied to all industries within a sector. Industries for which the fit appeared especially poor were excluded from these exploratory analyses (industries with residuals more than three standard deviations out).

Table 18: Comparison to BMGK

  BMGK-type specification BMGK plus human assets
Variable Coefficient Significance Coefficient Significance
IT -.0041722 0.097 .0015025 0.582
Equipment .0183582 0.173 .0308703 0.020
Trade -.0951059 0.064 -0014399 0.979
Education N/A N/A -.372123 0.000

The coefficients in the BMGK-type specification for both IT and equipment have the same signs as in BMGK. Adding the explicit measure of human assets, however, reverses the sign on the coefficient for IT. This suggests that in BMGK the IT coefficient picks up the effects of more highly skilled human assets which, as was argued above, are likely to be complementary to the use of IT.

The coefficient on equipment is positive in BMGK and in the regressions following their specifications here. This result changes when the tobacco products industry (SIC 21) is excluded. BMGK use the number of employees per establishment as the dependent variable in most of their regressions. In the one where they use the number of employees per firm, as is the case here, the effect of equipment investment is not significant. In fact, the equipment variables which are lagged by more than one year receive negative coefficients. In combination, these changes in specification and data appear to explain the different sign on the coefficient for equipment. The negative coefficient for the capital intensity of sales found here is consistent with the ideas of capital-labor substitution and distribution of physical assets.

The one result from BMGK that could not be replicated here for any specification is the positive and significant coefficient for the effects of trade on firm size. In all regressions here, the effect was negative or not significant. The regressions here use the import share instead of the total trade share (i.e. the numerator of the measure is imports as opposed to imports plus exports). This change does not explain the difference in the sign of the coefficient. Imports and exports are highly correlated (> 92%) and regressions using the trade share measure were not noticeably different. The negative coefficient is consistent with the hypothesis that trade liberalization results in a relocation of manufacturing establishments to lower wage countries. The negative coefficient is also in line with related empirical research. For instance, one study (Caves and Krepps 1993) showed that increases in trade resulted in a reduction in employment by American firms.47

5.6.2 Exploratory Regression for Retail

The regression for the retail sector uses the number of employees per firm as the dependent variable (the independent variables are as before, but do not include the import share). The results are shown in Table 19.48

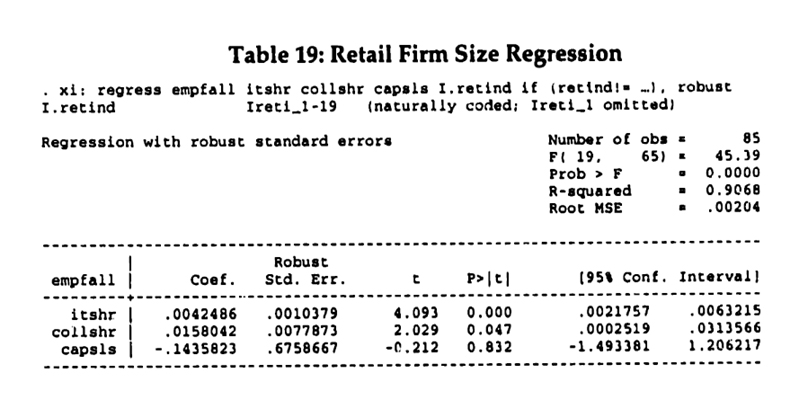
As expected, physical assets as measured by the capital intensity of sales turn out not to be a significant factor in retail confirming the results from the simple correlations.

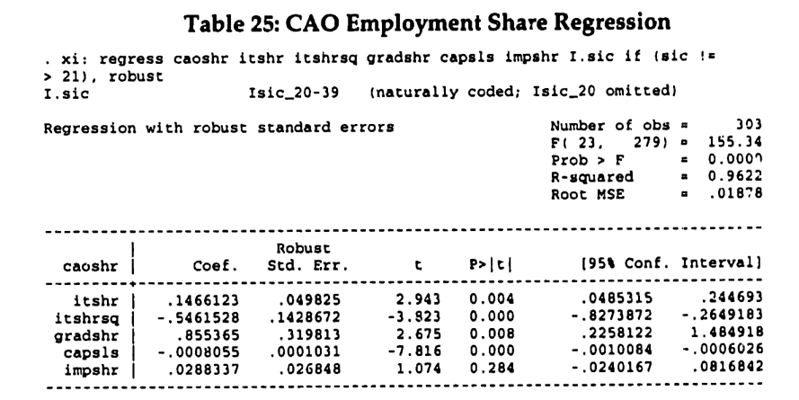
The positive and significant coefficient on human assets, however, is a surprising result at first. A likely explanation involves simultaneity, which is not controlled for here. Small retail firms with a single or a few stores usually do not have any central functions (e.g. central purchasing, human resources) where more highly skilled human assets are likely to be required. Large retail firms that operate chains of many stores on the other hand are known to have centralized a lot of decision making (for instance, most of Wal-Mart's product selection is handled at headquarters). This explanation of the positive coefficient for human assets is supported by considering separate regressions for the employees per retail establishment and the establishments per retail firm. Human assets are a significant factor only for the latter. Further confirmation is provided below by regressions which explicitly consider employees in centralized functions.

47 An alternative hypothesis is that larger markets can support larger firms. While many US firms have clearly extended their global scale, they have often done so through international offices, which would not be counted in domestic employment. Furthermore, increases in scale due to internationalization are frequently accompanied by reductions in scope. The data does not appear to support this alternative hypothesis.
48 Department stores and shoe stores were excluded as outliers based on a residual analysis.

5.6.3 Exploratory Regression for Services

Finally, similar regressions were examined for the industries in the service sector. The results for the basic specification are shown in Table 20.49 As in the retail sector, physical asset intensity does not seem to be important in determining firm size in the service sector. Information assets, as measured by IT, have a strong and highly significant positive effect on firm size.

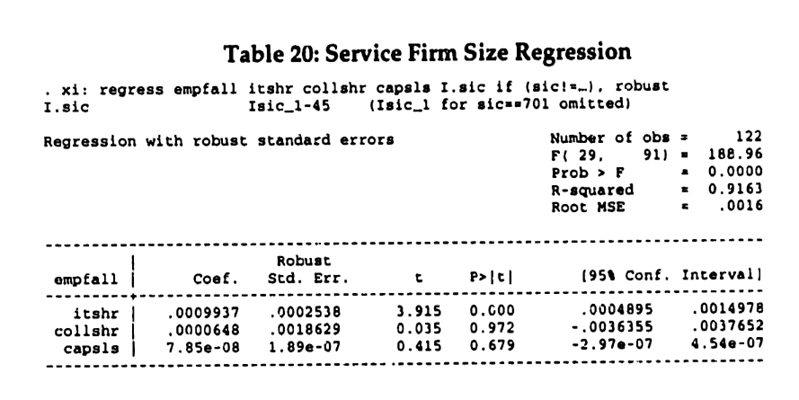
Surprisingly, human assets also do not appear to be a significant factor. The service sector was seen to have the highest level of human assets and so it is possible that college education is not a sufficiently strong discriminator between industries. The results of using the percentage of employees with at least some graduate education instead are shown in Table 21.

49 Hotels, personal services, and personnel supply services were excluded since a residual plot identified them as outliers.

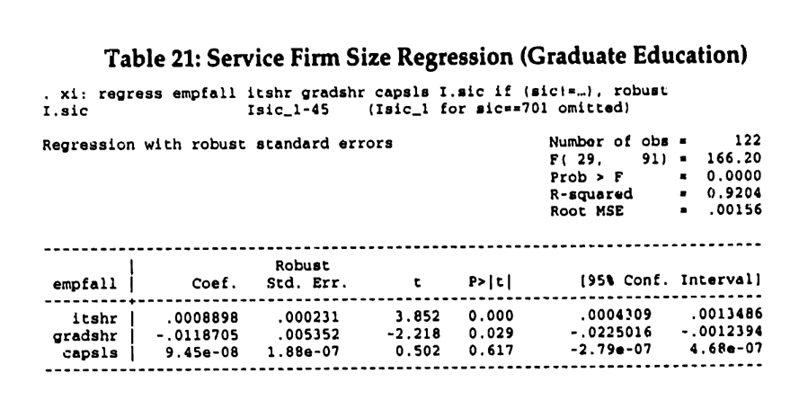
Now the increased importance of human assets can be seen to result in reduced firm size. Physical assets do not appear to have a significant effect on firm size for the service sector.

6. DISCUSSION

6.1 Changes in Firm Size and IT

The evidence as presented provides some support for the channels of influence for IT that were hypothesized in Section 3. Furthermore, the dominant forces and the net effects appear to differ significantly between manufacturing sector on the one hand and the retail and service sectors on the other. Manufacturing firms are shrinking while retail and service firms are growing.

For the manufacturing sector, the dominant effects appear to be the increased flexibility of physical assets, the heightened importance of skilled human assets, and the reduced coordination cost. As discussed in Section 3, all of these effects favor smaller firms. Both in the correlation and the regression analyses, the coefficients point generally in the hypothesized direction. Information assets appear to have the hypothesized effect of leading to larger firms, but for manufacturing they are outweighed by the effects of physical assets and human assets. It must be emphasized again, however, that the information in the data set considers domestic establishments only. To the extent that manufacturing firms have added international establishments due to the effects of information assets, this will not be captured here. It is thus possible that on the global scale the effects of information assets are stronger and manufacturing firms are in fact growing.

For physical assets, three different paths of influence were identified. First, IT makes physical assets more productive, which may result in substitution of physical assets for human assets. Second, IT makes physical assets more flexible, which may result in their distribution across more firms. Third, reduced cost of coordination may permit the outsourcing of activities. There are several pieces of evidence that rule out substitution as the sole explanation. The Census data provides a comprehensive picture of the manufacturing sector, which includes all firms that were active during the Census year. Table 22 shows the changes in the total number of employees and the total number of firms between 1967 and 1992.

Table 22: Manufacturing Sector Summary Statistics

Year Empl. ('000) Finns Empl/Firm
1967 18,092 274,156 65.99
1992 16,949 328,952 51.52

The reduction in overall employment in manufacturing can be explained solely by the capital-labor substitution hypothesis. The simultaneous increase in the number of firms, however, cannot. Clearly the overall decrease in the number of employees per firm in manufacturing is to a large degree explained by the increase in the number of firms. This change is consistent with the increased distribution of physical assets across a larger number of firms, due to increased physical asset flexibility and reduced coordination cost.

Another piece of evidence that favors increased physical asset distribution due to IT as a path of influence was mentioned in Section 5.2 above: as seen in Table 8, the percentage of total capital expenditure in manufacturing attributable to small firms has been increasing. This finding fits with increased asset flexibility and reduced coordination cost but is not readily explained by substitution. Finally, the long-difference correlations also support increased capital flexibility and reduced coordination cost since they measure long-run changes. Capital-labor substitution is by comparison a short-run effect. When firms invest in machinery to substitute for employees, they usually have investment horizons of a couple of years. A restructuring of an entire industry into larger or smaller firms on the other hand usually takes place over many years.

For the retail and service sectors, the dominant effect instead appears to be the increased importance of information assets which results in larger firms. The influence of physical assets seems to be insignificant for both the retail and service sectors. The results for human assets were somewhat inconclusive, with higher skill levels associated with larger firms in retail and smaller firms in services. More insight into this difference is gained by considering the two paths through which information assets may influence firm size.

As with physical assets, three different paths of influence on firm size were identified. First, information assets may be complementary with skilled human assets which could result in an increase in firm size, measured by the number of employees. In fact, correlation analysis shows that skilled human assets are positively and significantly correlated with investment in information assets in both manufacturing and retail, providing support for such a complementarity. For the service sector the correlation is negative but not significant. Second, reduced coordination cost may permit the sharing of information assets between firms. This effect would result in smaller firms. Third, to the extent that information assets require concentration of assets among fewer firms in order to exploit complementarity among information assets they should be associated with larger firms. The results of the correlation and regression analyses suggest that with respect to information assets, reduced coordination costs are outweighed by the need to bring information assets under unified management. This third influence path is analyzed in greater detail in the next section.

6.2 Information Assets Explored

Information assets are most readily identified in the context of multi-establishment firms. One of the foremost reasons for owning multiple establishments in different locations is to leverage information. Information generated in one location can be applied equally in other locations with no or little additional cost, which can result in informational economies of scale (Wilson 1975). As was argued above, there are substantial hurdles to sharing this information through a transaction between two firms. In some instances, the only solution is for the firms to merge. The increased use of IT may also favor the ownership of multiple establishments through the interaction between incentives for initiative and the need for coordination, as shown in a separate paper (Wenger, 1998). That paper also shows that as the use of IT increases further, "networked" organization structures may emerge in which establishments cooperate without the need for ownership.

To examine these ideas, a variety of regressions were run on the available data. For instance, using the number of establishments per firm (estfall) in manufacturing as the dependent variable gives the results shown in Table 23.

These results suggest that the way IT operates is by making it more effective to own multiple establishments, which supports the interpretation of IT as providing a measure of the importance of information assets. Interestingly, even more IT appears to reduce the number of establishments again (as seen by the negative coefficient on the squared IT share term), which might be evidence for a shift to a type of "networked" relationship (without ownership).50

It is also interesting to note that the coefficient on human assets is not significant in this regression. This is in line with the hypothesis that human assets may be important for making use of information assets, so that the coefficient picks up both the positive effect of the complementarity with information assets and the negative effect of the changed employment relationship.

These results are confirmed further by considering the number of establishments per firm (estfall) in services as shown in Table 24.

Again the pattern of IT initially contributing to an increase in the number of establishments per firm and then to a reduction is confirmed.51

The pattern does, however, not appear to apply to retail. In the establishments per firm regression, the coefficient for the squared IT term is not significant. These findings are consistent with the trends for the number of establishments per firm as shown in Figure 3. In the manufacturing sector the number of establishments per firm has started to decline, whereas it is rising moderately in the service sector and strongly in the retail sector.

50 Based on itshr alone, the number of establishments would reach its maximum for itshr* = 0.326 / (2 • 0.813) = 0.200. The average itshr for manufacturing stays well below this value, but for individual industries it is exceeded (first in 1987, for SIC 36 - electrical equipment, and SIC 38 - instruments and then in 1992, also for SIC 27 - printing and publishing, SIC 32 - mineral products, and SIC 35 - industrial machinery).
51 Based on itshr alond, the number of establishments would reach its maximum for itshr* = 0.141 / (2 • 0.048) = 1.469. Since itshr is the share of IT stock in total equipment, the value cannot exceed 1 and hence the maximum cannot be attained.

Further support for the pattern can be found by using data on the number of employees in so-called "Central Administrative Offices" (CAOs). These are establishments that only serve the purpose of providing management and other administrative functions for other establishments. The dependent variable for the regression is the share of all employees that work in a CAO (caoshr).52 The results for the manufacturing sector are shown in Table 25.

The results suggest that IT first increases the percentage of employees in CAOs, which would be consistent with an attempt to exploit informational economies of scale. Further increases in IT then reduce the percentage of employees in CAOs, which would be consistent with a transition to a "networked" organization. The coefficient on human assets is positive and significant, providing further evidence for the importance of human assets in drawing benefits from information assets. The coefficient on the import share is also positive (although not significant), which is consistent with the possibility that an international expansion of manufacturing firms explains the decrease in their domestic size.

52 The relevant data was obtained directly from the Department of Commerce.

7. Lessons Learned and next steps

7.1 Large Trends

Clearly the data presented here reflect a high level view of the economy. No claim is made to understand the exact ways in which IT changes a particular segment of a specific industry. Instead, the emphasis has been on discerning large trends and seeing whether they plausibly might be related to IT. One of the first conclusions is that there do indeed appear to be large trends in firm size that cut across many industries. The trends follow different directions for manufacturing (decreasing) and retail and services (increasing) and appear to be correlated with the use of IT, These findings support the view that IT is a general purpose technology which affects large sections of the economy.

7.2 The Crucial Role of Information Assets

Several paths through which IT is likely to affect firm size were identified. For instance, IT appears to contribute indirectly to smaller firms in manufacturing by making physical assets more productive (substitution for labor), by making them more flexible (distribution across more firms), and by reducing coordination cost. A significant effect of IT, however, seems to operate through the increased importance of information assets. These information assets appear to be difficult to share through contractual arrangements. Hence, as IT increases the complementarity among information assets, previously separate establishments are combined into larger firms. Based on the results from the exploratory analyses in this paper, the information asset effect of IT appears to be a significant factor in the consolidation waves that are currently reshaping many industries, especially in the retail and service sectors.

7.3 Next Steps

There is considerably more data available on the large scale effects of IT than has been presented here. Some of it has already been collected and is in the process of being analyzed, but much of it still remains inaccessible at the Census Bureau. In particular, adding data for 1997 would extend the available data into the present. Given the continually rising investment in IT and the trends observed so far, the changes since 1992 are likely to be especially informative. Furthermore, the Census Bureau's maintains an annually updated database of establishments which contains the ownership of establishments by multi-establishment firms. This information would be invaluable for a more detailed analysis of the changes in firm size. More information would also enable the application of more demanding regression techniques, such as two-stage least squares.

In addition, it would be useful to complement the very broad level with several focused industry studies that gather detailed information on the three types of assets and analyze how they have affected the size of firms. One of the major obstacles to such an effort would be the acquisition of the kind of historical data used here. Finally, already the evidence presented here raises some interesting questions that may give rise to new theoretical endeavors, such as modeling the dynamic process by which IT affects firm size through the direct and indirect paths explored in this paper.

Appendix: Data Construction

Al. Firm Size Data

All firm size data is taken from the Census of Manufactures, the Census of Retail Trade, and the Census of Selected Services respectively. The Census years for which at least some of the data is available are 1958, 1963, 1967, 1972, 1977, 1982, 1987, and 1992. The 1997 Census data will not be available until late 1998 or even early 1999. For the years 1992 and 1987, the data was downloaded from the Census Bureau CD Roms. For earlier years, the data was entered from Census Bureau publications. The data was compiled at the 2-digit level for manufacturing and the 3 digit level for retail and services. These levels were dictated by the level at which the number of firms is available as a survey statistic over the relevant time period. For each of the three sectors (manufacturing, retail, and services), a concordance of SIC codes was established to ensure a stable set of industries over time, despite a variety of SIC code changes. This was relatively straightforward since most of the changes took place at lower SIC levels than the ones considered here.

Two major corrections to the data were required. First, the distinction between so-called single establishment and multi establishment firms poses a problem. A firm for purposes of the Census statistics is defined at the level of a particular SIC code under consideration. Suppose that a firm owns many establishments across multiple industries but happens to have only one establishment in SIC 561. In the years up to 1982, it was counted into the single establishment category for SIC 561. For later years such a firm was counted into the multi-establishment category. Fortunately, the earlier years provided a break out so that all the data was standardized to counting these as multi-establishment firms (i.e. the format of more recent years). The reason for this choice is that such establishments are likely to differ in size from real single establishment firms, for instance, due to the existence of separate headquarters establishments. Second, for both the retail and service sectors, an adjustment had to be made for the treatment of so-called non-employer firms. These are firms that report no payroll and hence pay no payroll taxes. While these include single proprietorships, the majority of non-employer firms represent some form of tax shelter and thus contain very little real economic activity. The number of these non-employer firms has exploded in both retail and services since 1982 (in retail from about 600 thousand establishment to 1.2 million and in service from 2.9 to 6.8 million). Until 1977 non-employer establishments were counted in the statistics, but were broken out separately. To avoid biasing the average firm size by including non-employer firms, they were subtracted out for 1977 and earlier years.

A2. Physical Capital and IT Capital Data

The initial source for the physical capital and IT capital data is the Bureau of Economic Analyses (BEA). The BEA publishes tables of "Fixed Reproducible Wealth” which are also available electronically and are based on the same underlying data as the National Income and Product Accounts (NIPA). The BEA provides gross and net capital stocks in both current and constant dollars for a variety of assets. Only the gross series in current dollars was used here. Most analyses were conducted in two different ways: first using the gross series with implicit deflators and second using net series which were constructed from the gross series. The implicit deflator approach relies on ratios between two current dollar series. Concretely, IT capital was measured as a percentage of all equipment and capital intensity was measured as a ratio of physical capital to sales. This approach is not only easy to implement but also provides a useful baseline. For the net stock approach, the gross stock series was first converted into an investment series, which was then deflated to 1982. All deflators were taken from the Bureau of Labor Statistics Price series, except for the IT deflator which was allowed to range from 10% to 20% for the annual improvement in price (Gordon 1990). The deflated investment series was then recombined into a net stock series based on assumptions about depreciation (4 years for IT capital, 7 years for regular capital, and 10 years for structures). All reported correlation and regression results are based on net stock series.

IT capital was taken to be the sum of two BEA asset categories: office, computing, and accounting machinery (OCAM) and communication equipment (CE). Some studies have used only OCAM, noting that CE is distributed unevenly across industries. While that was the case until 1978, since then CE has grown tremendously in most industries. Over the same time period OCAM growth has slowed down even in current dollars. This suggests that OCAM by itself is too narrow a category. First, overall IT spending as reflected in other sources (e.g. IT industry output) has certainly not been slowing down. Second, since the mid-80's at the latest computer networking and other communication equipment are an increasingly important aspect of IT spending.

The BEA data has its own industry codes, which need to be mapped to SIC codes. For manufacturing, there is a one-to-one mapping between BEA industry codes and 2-digit SIC codes. All of retailing, however, is combined into a single BEA code. This required a way of distributing the BEA series for retailing across the 3-digit level. Fortunately, in recent Census years (since 1982) relatively detailed capital expenditure data was collected. This data was used to derive a percentage distribution across the 3-digit retail industries, which was then extrapolated to earlier years and applied to the BEA series. A similar approach was pursued for service industries. There, however, the BEA data is quite a bit more detailed (6 different series) so that less work was required to distribute the capital across the 3-digit industries. Again, the distribution was accomplished using the detailed capital expenditure surveys from recent Census years.

A3. Human Capital Data

The human capital data comes from the Current Population Survey (CPS). Random extracts for the relevant years were obtained from the National Bureau of Economic Research (NBER). Each data point represents an individual. The CPS industry codes were mapped to SIC codes at the required level and then per-industry averages were calculated across the random extracts for a variety of human capital proxies. Sometimes a CPS industry code combined two or more 3-digit SIC codes. In those cases the same average was computed for each SIC code.

REFERENCES

Alchian, A. A. and H. Demsetz (1972). "Production, Information Costs, and Economic Organization." American Economic Review 62: 777-95.
Arrow, K. (1973). Information and Economic Behavior. Stockholm, Svanback & Nymans.
Autor, D., L. Katz, et al. (1997). "Computing Inequality: Have Computers Changed the Labor Market?" mimeo.
Baker, G., R. Gibbons, et al. (1995). "Implicit Contracts and the Theory of the Firm." mimeo.
Berndt, E. R., C. J. Morrison, et al. (1994). "High-Tech Capital Formation and Economic Performance: An Exploratory Study." lournal of Econometrics 65(1): 9-43.
Brynjolfsson, E. (1994). "Information Assets, Technology, and Organization." Management Science 40(12): 1645-1662.
Brynjolfsson, E. (1996). "The Contribution of Information Technology to Consumer Welfare." Information Systems Research(September).
Brynjolfsson, E. and L. Hitt (1993). "Is Information System Spending Productive? New Evidence and New Results." Proceedings of the 14th International Conference on Information Systems.
Brynjolfsson, E. and L. Hitt (1996). "Paradox Lost? Firm-level Evidence on the Returns to Information System Spending." Management Science 42(4): 541-558.
Brynjolfsson, E., T. W. Malone, et al. (1994). "Does Information Technology Lead to Smaller Firms?" Management Science 40(12): 1628-1644.
Brynjolfsson, E. and S. Yang (1997). "The Intangible Benefits and Costs of Computer Investments: Evidence from the Financial Markets." Proceedings of the 17th International Conference on Information Systems.
Caves, R. E. and M. B. Krepps (1993). "Fat: The Displacement of Nonproduction Workers from U.S. Manufacturing Industries." Brookings Papers on Economic Activity: Microeconomics^): 227-288.
Chandler, A. D.J. (1977). The Visible Hand. Cambridge, Massachusetts, Harvard University Press.
Coase, R. (1937). "The Nature of the Firm." Economica n.s.(4): 386-405.
David, P. A. (1989). "Computer and Dynamo: The Modern Productivity Paradox in a Not-Too-Distant Mirror." Center for Economic Policy Research Publication No. 172.
Eaton, L. (1997). Spinoffs Become the Trendy Thing to Do. New York Times. January 30, p. Dl.
Gordon, R. J. (1990). The measurement of durable goods prices. Chicago, University of Chicago Press (for the National Bureau of Economic Research).
Hart, O. and J. Moore (1990). "Property Rights and the Nature of the Firm." Tournal of Political Economy 98(December): 119-1158.
Holmstrom, B. (1997). "The Firm as a Subeconomy." MIT Department of Economics, mimeo.
Joskow, P. L. (1985). "Vertical Integration and Long-term Contracts: The Case of Coal-Burning Eclectric Generating Plants." lournal of Law. Economics, and Organization.
Konsynski, B. R. and F. W. McFarlan (1990). "Information Partnerships - Shared Data, Shared Scale." Harvard Business Review (Sept-OctV. 114-120.
Malone, T. W., J. Yates, et al. (1987). "Electronic Markets and Electronic Hierarchies." ACM 30(6): 484-497.
Pindyck, R. S. and D. L. Rubinfeld (1991). Economic Models and Economic Forecasts. New York, McGraw-Hill.
Siconolfi, M. and A. Raghavan (1997). Wall Street Wants The 'Little Guy,' and It Will Merge to Get Him. Wall Street lournal. February 6, p. Al.
Wenger, A. (1998). Information Technology and Hybrid Organizations, MIT Sloan School of Management, mimeo.
Williamson, O. E. (1973). "Markets and hierachies: Some elementary considerations." American Economic Review 63(May): 316-25.
Wilson, R. (1975). "Informational Economies of Scale." Bell lournal of Economics 6(1): 184-195.
Womack, J. P., D. T. Jones, et al. (1990). The Machine That Changed The World. New York, Rawson Associates.
Zuboff, S. (1985). Technologies That Informate: Implications for Human Resource Management in the Computerized Industrial Workplace. HRM: Trends and Challenges. R. E. Walton and P. R. Lawrence. Boston, MA, Harvard Business School Press.